Cities
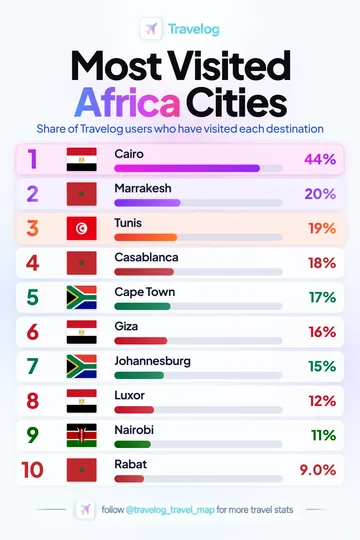
Most visited cities — Africa
Cairo is ranked first in this Travelog collection at 44%, followed by Marrakesh at 20%.
View image and data → Travelog
TRAVELOG STATISTICS LIBRARY
564 collections with original graphics, readable tables and downloadable data.
Regional and thematic collections are kept separately. Two near-duplicate world charts are excluded. Each collection states its own scope and units. About the data
564 collections
Cairo is ranked first in this Travelog collection at 44%, followed by Marrakesh at 20%.
View image and data →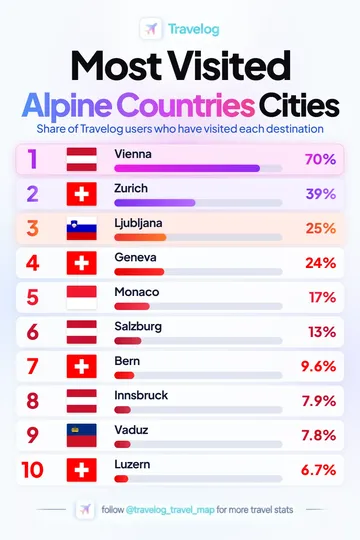
Vienna is ranked first in this Travelog collection at 70%, followed by Zurich at 39%.
View image and data →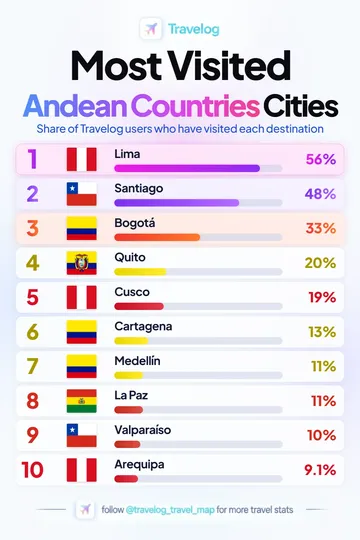
Lima is ranked first in this Travelog collection at 56%, followed by Santiago at 48%.
View image and data →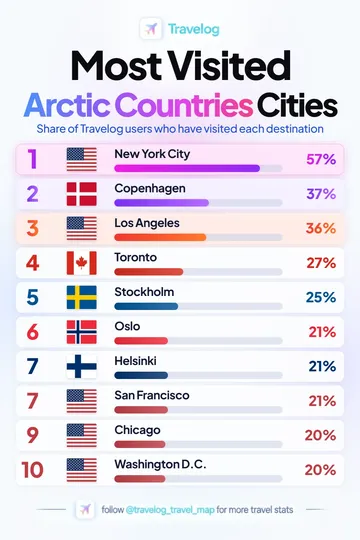
New York City is ranked first in this Travelog collection at 57%, followed by Copenhagen at 37%.
View image and data →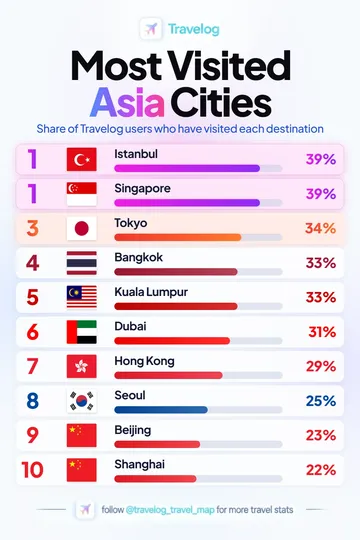
Istanbul is ranked first in this Travelog collection at 39%, followed by Singapore at 39%.
View image and data →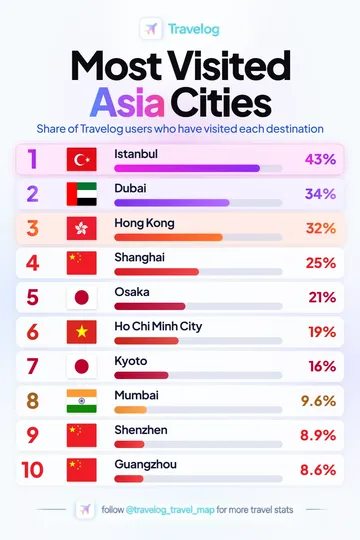
Istanbul is ranked first in this Travelog collection at 43%, followed by Dubai at 34%.
View image and data →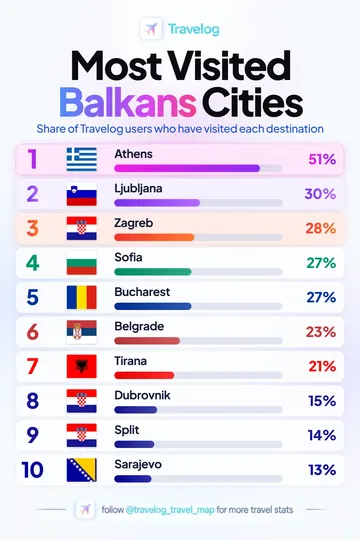
Athens is ranked first in this Travelog collection at 51%, followed by Ljubljana at 30%.
View image and data →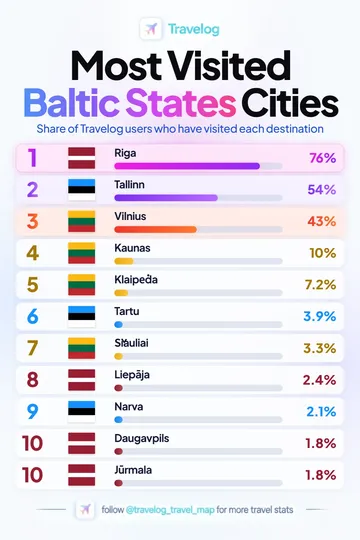
Riga is ranked first in this Travelog collection at 76%, followed by Tallinn at 54%.
View image and data →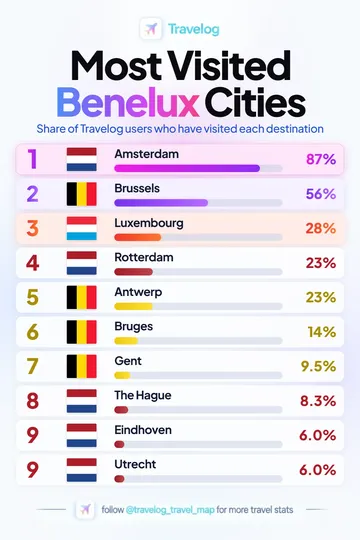
Amsterdam is ranked first in this Travelog collection at 87%, followed by Brussels at 56%.
View image and data →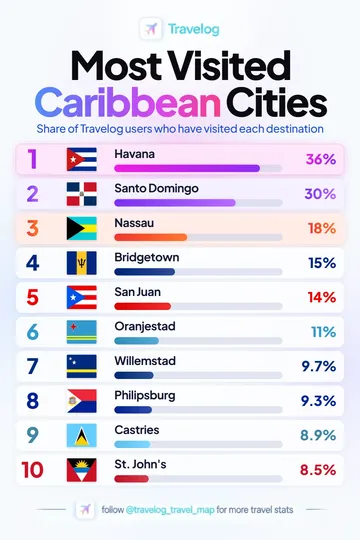
Havana is ranked first in this Travelog collection at 36%, followed by Santo Domingo at 30%.
View image and data →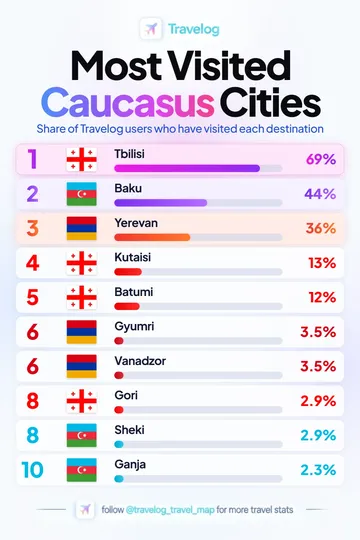
Tbilisi is ranked first in this Travelog collection at 69%, followed by Baku at 44%.
View image and data →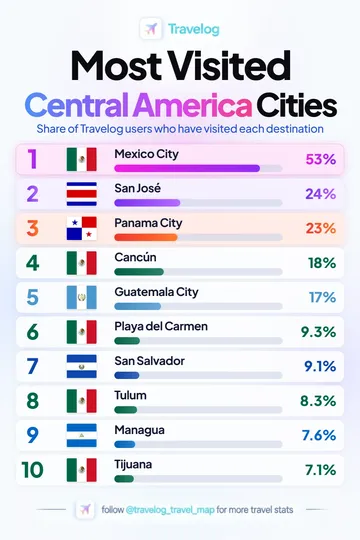
Mexico City is ranked first in this Travelog collection at 53%, followed by San José at 24%.
View image and data →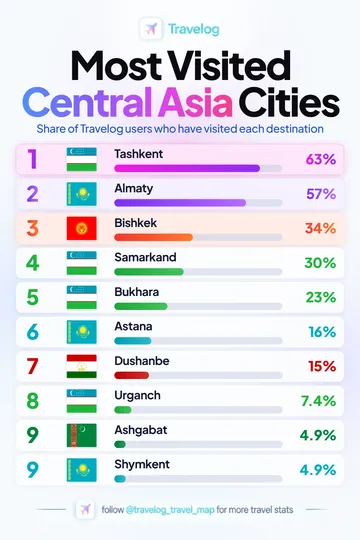
Tashkent is ranked first in this Travelog collection at 63%, followed by Almaty at 57%.
View image and data →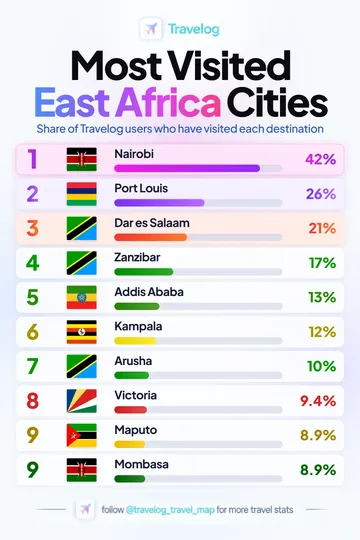
Nairobi is ranked first in this Travelog collection at 42%, followed by Port Louis at 26%.
View image and data →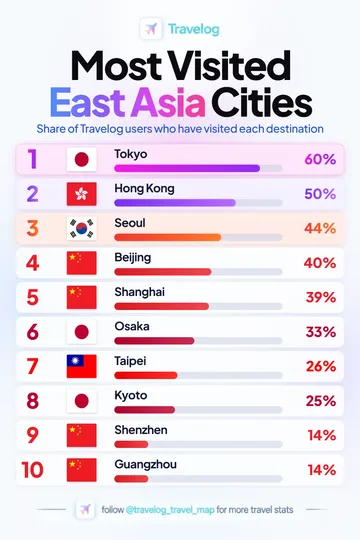
Tokyo is ranked first in this Travelog collection at 60%, followed by Hong Kong at 50%.
View image and data →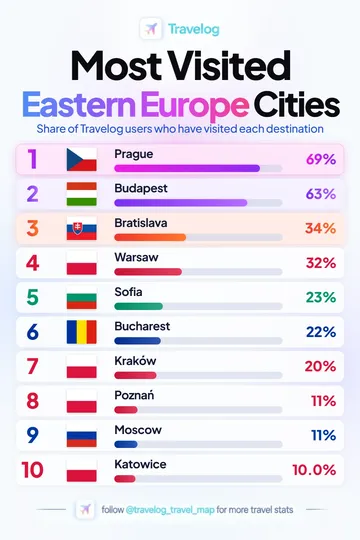
Prague is ranked first in this Travelog collection at 69%, followed by Budapest at 63%.
View image and data →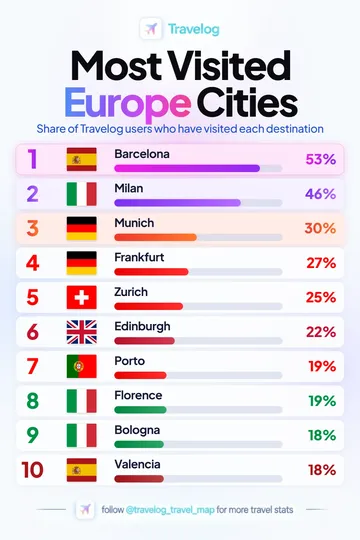
Barcelona is ranked first in this Travelog collection at 53%, followed by Milan at 46%.
View image and data →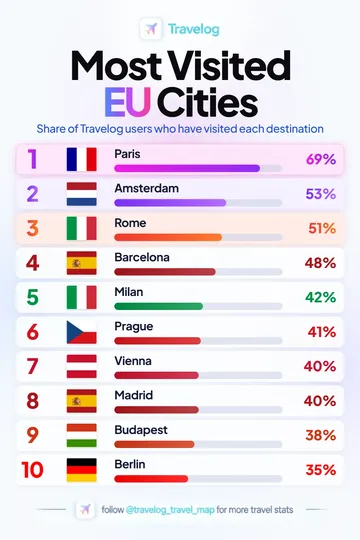
Paris is ranked first in this Travelog collection at 69%, followed by Amsterdam at 53%.
View image and data →
Hong Kong is ranked first in this Travelog collection at 67%, followed by Beijing at 53%.
View image and data →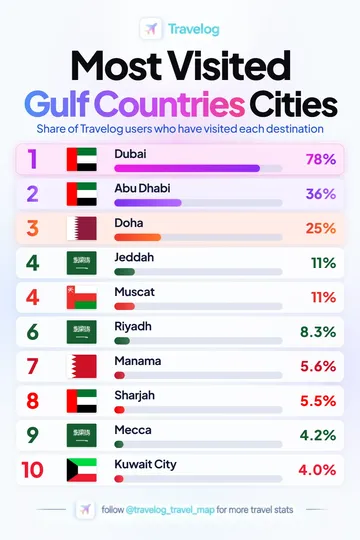
Dubai is ranked first in this Travelog collection at 78%, followed by Abu Dhabi at 36%.
View image and data →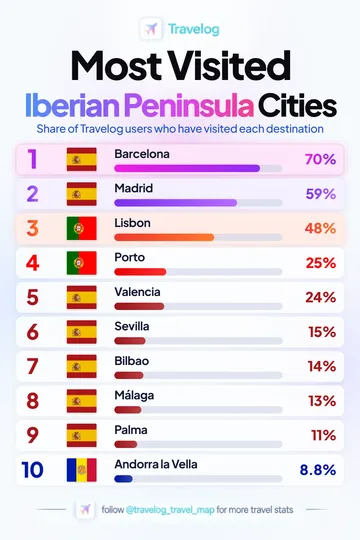
Barcelona is ranked first in this Travelog collection at 70%, followed by Madrid at 59%.
View image and data →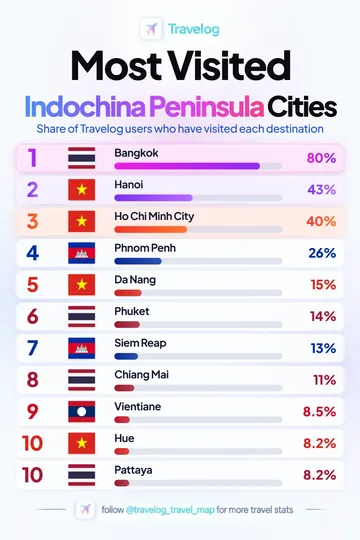
Bangkok is ranked first in this Travelog collection at 80%, followed by Hanoi at 43%.
View image and data →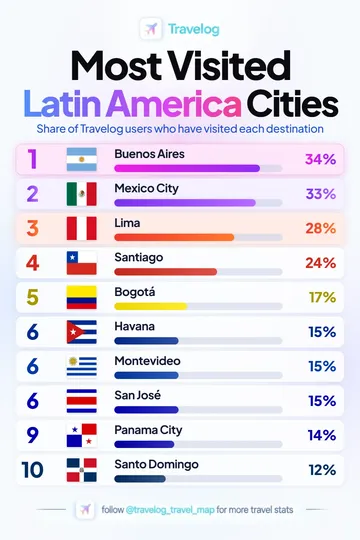
Buenos Aires is ranked first in this Travelog collection at 34%, followed by Mexico City at 33%.
View image and data →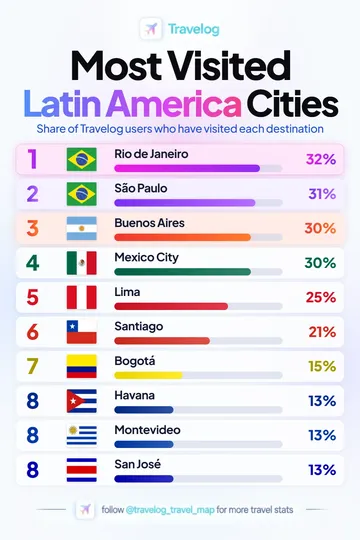
Rio de Janeiro is ranked first in this Travelog collection at 32%, followed by São Paulo at 31%.
View image and data →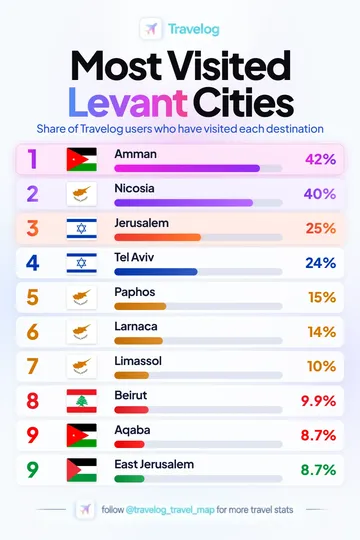
Amman is ranked first in this Travelog collection at 42%, followed by Nicosia at 40%.
View image and data →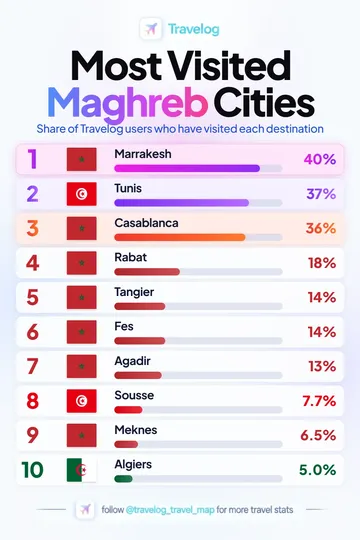
Marrakesh is ranked first in this Travelog collection at 40%, followed by Tunis at 37%.
View image and data →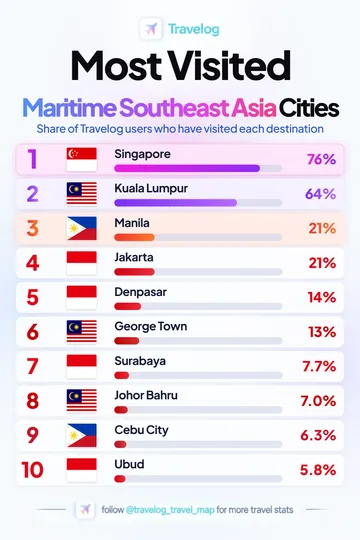
Singapore is ranked first in this Travelog collection at 76%, followed by Kuala Lumpur at 64%.
View image and data →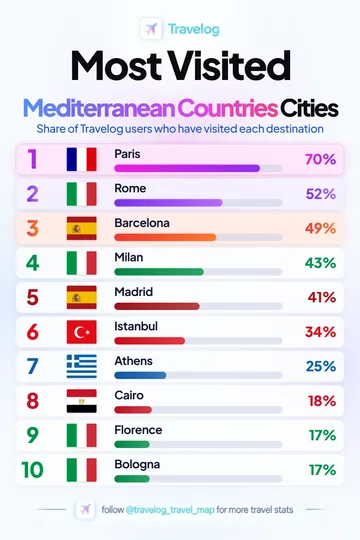
Paris is ranked first in this Travelog collection at 70%, followed by Rome at 52%.
View image and data →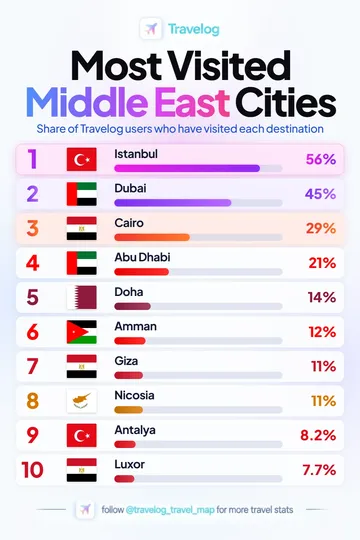
Istanbul is ranked first in this Travelog collection at 56%, followed by Dubai at 45%.
View image and data →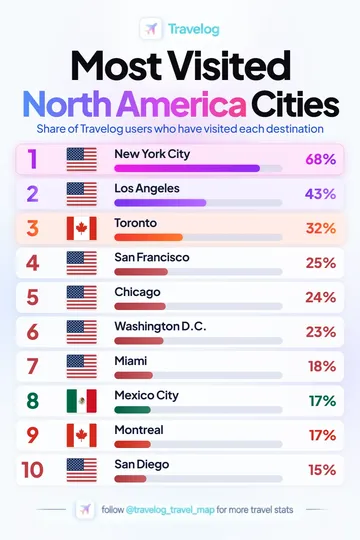
New York City is ranked first in this Travelog collection at 68%, followed by Los Angeles at 43%.
View image and data →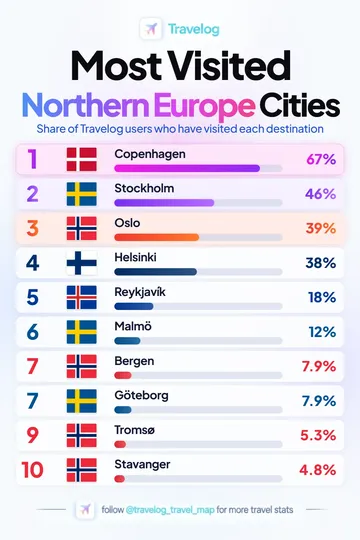
Copenhagen is ranked first in this Travelog collection at 67%, followed by Stockholm at 46%.
View image and data →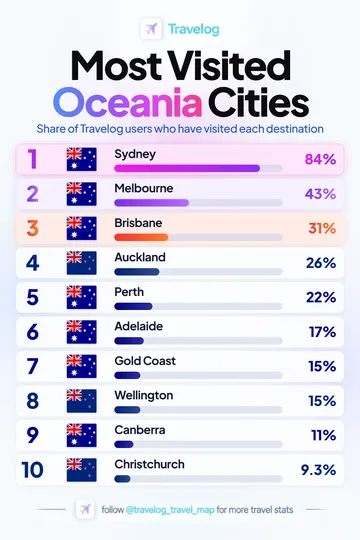
Sydney is ranked first in this Travelog collection at 84%, followed by Melbourne at 43%.
View image and data →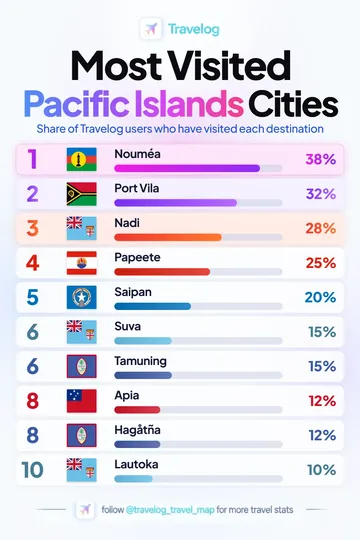
Nouméa is ranked first in this Travelog collection at 38%, followed by Port Vila at 32%.
View image and data →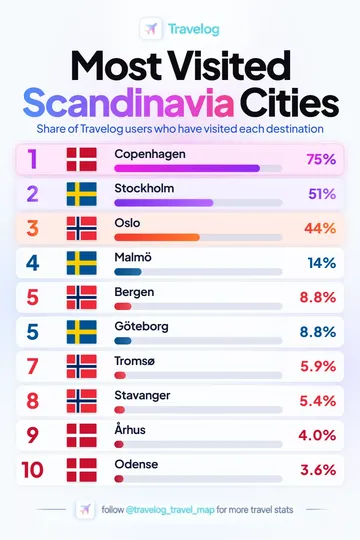
Copenhagen is ranked first in this Travelog collection at 75%, followed by Stockholm at 51%.
View image and data →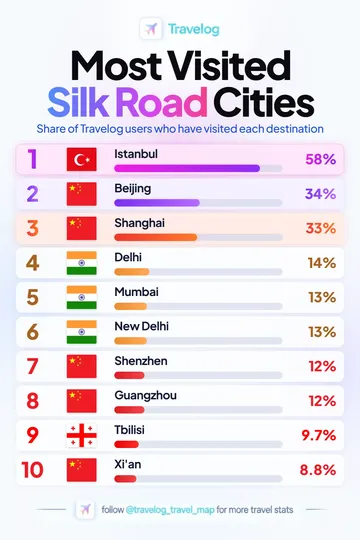
Istanbul is ranked first in this Travelog collection at 58%, followed by Beijing at 34%.
View image and data →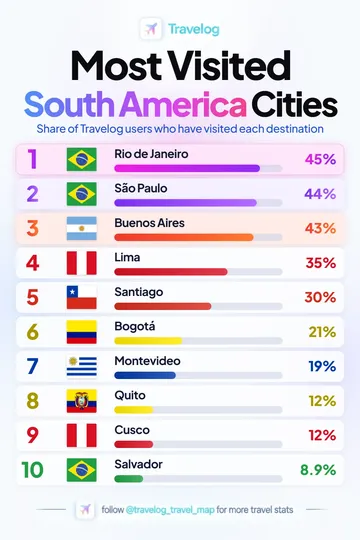
Rio de Janeiro is ranked first in this Travelog collection at 45%, followed by São Paulo at 44%.
View image and data →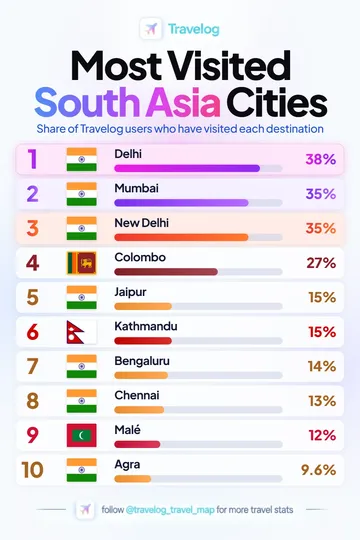
Delhi is ranked first in this Travelog collection at 38%, followed by Mumbai at 35%.
View image and data →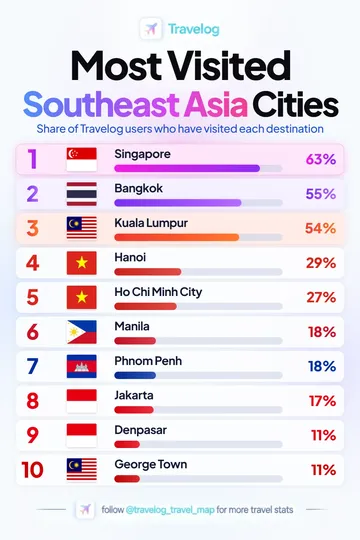
Singapore is ranked first in this Travelog collection at 63%, followed by Bangkok at 55%.
View image and data →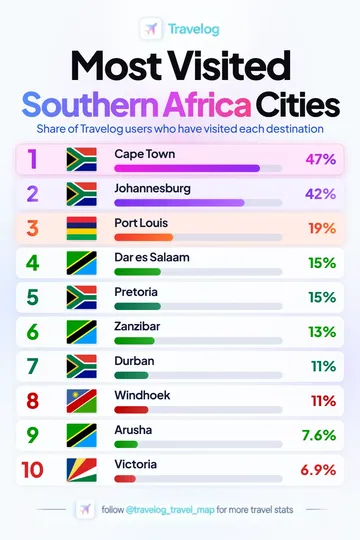
Cape Town is ranked first in this Travelog collection at 47%, followed by Johannesburg at 42%.
View image and data →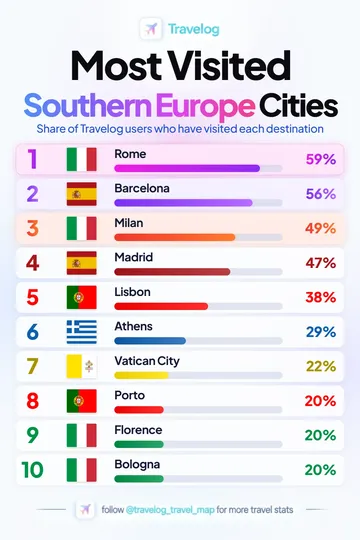
Rome is ranked first in this Travelog collection at 59%, followed by Barcelona at 56%.
View image and data →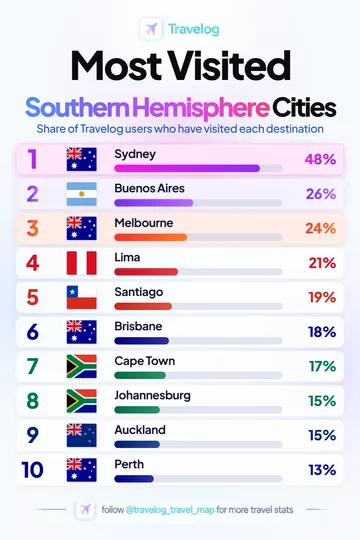
Sydney is ranked first in this Travelog collection at 48%, followed by Buenos Aires at 26%.
View image and data →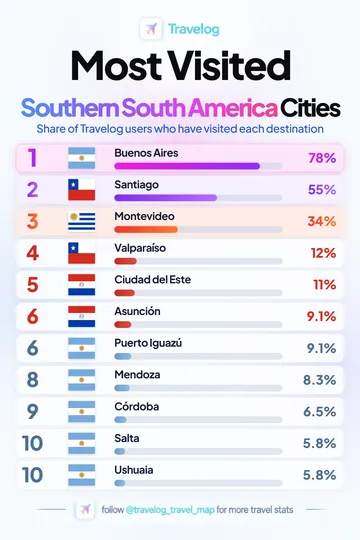
Buenos Aires is ranked first in this Travelog collection at 78%, followed by Santiago at 55%.
View image and data →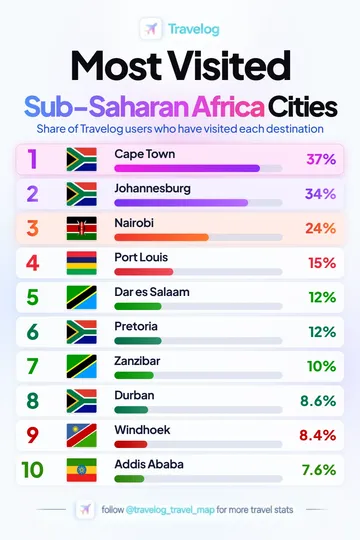
Cape Town is ranked first in this Travelog collection at 37%, followed by Johannesburg at 34%.
View image and data →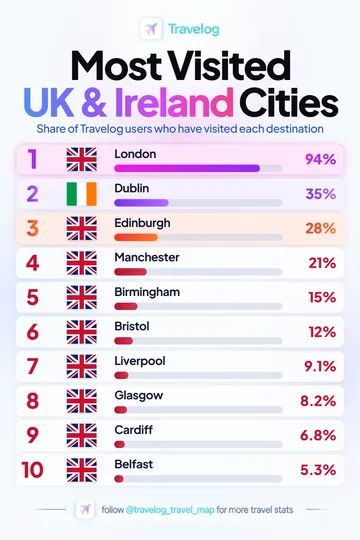
London is ranked first in this Travelog collection at 94%, followed by Dublin at 35%.
View image and data →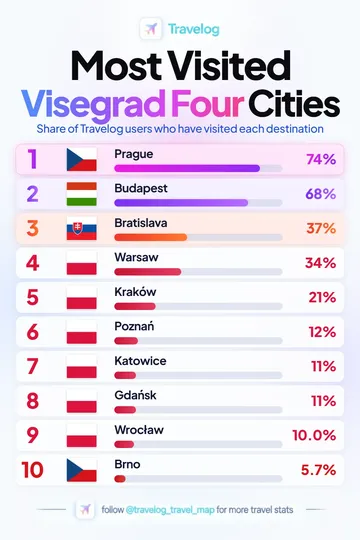
Prague is ranked first in this Travelog collection at 74%, followed by Budapest at 68%.
View image and data →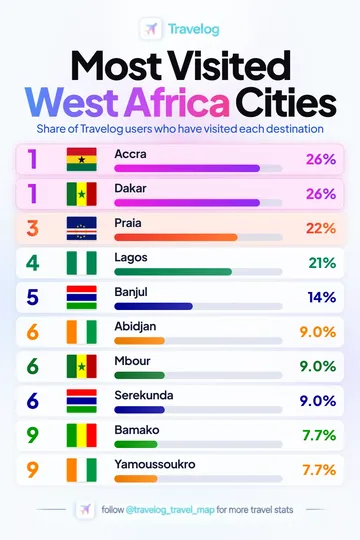
Accra is ranked first in this Travelog collection at 26%, followed by Dakar at 26%.
View image and data →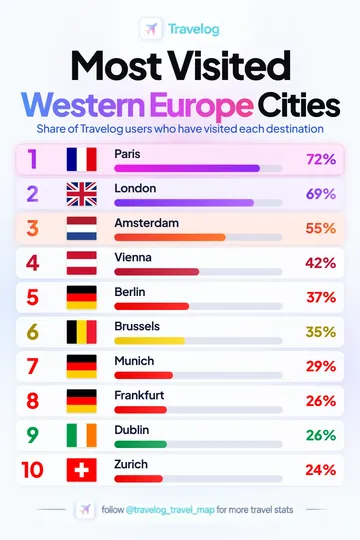
Paris is ranked first in this Travelog collection at 72%, followed by London at 69%.
View image and data →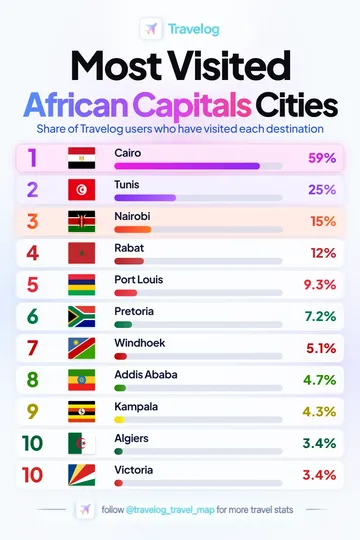
Cairo is ranked first in this Travelog collection at 59%, followed by Tunis at 25%.
View image and data →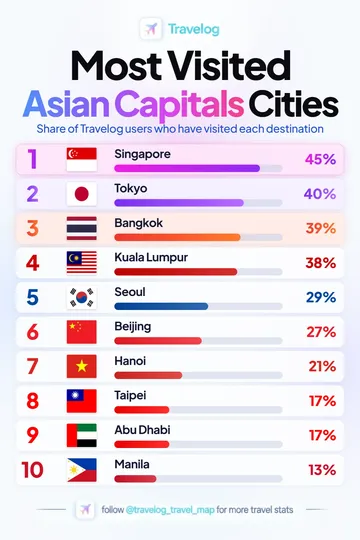
Singapore is ranked first in this Travelog collection at 45%, followed by Tokyo at 40%.
View image and data →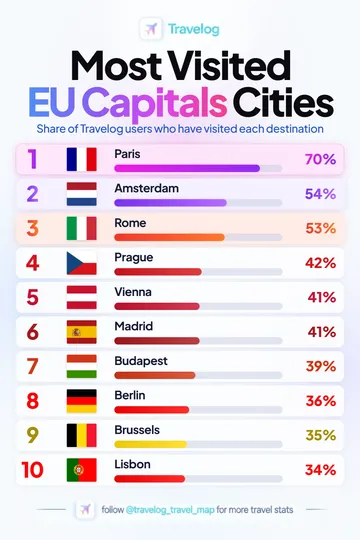
Paris is ranked first in this Travelog collection at 70%, followed by Amsterdam at 54%.
View image and data →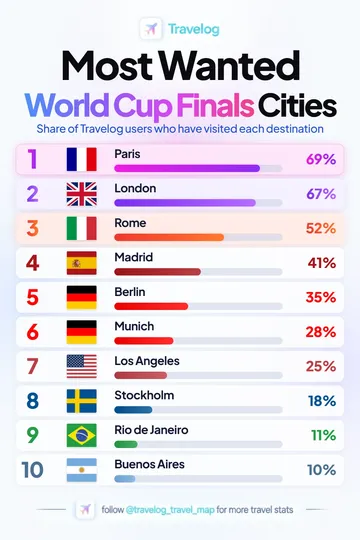
Paris is ranked first in this Travelog collection at 69%, followed by London at 67%.
View image and data →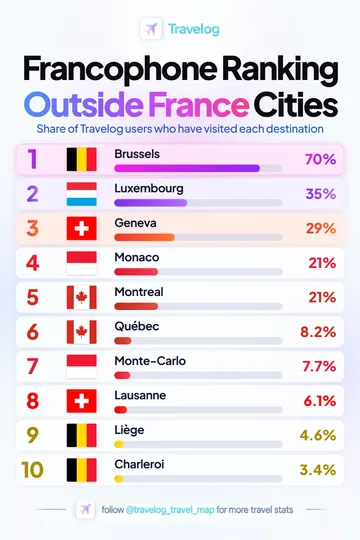
Brussels is ranked first in this Travelog collection at 70%, followed by Luxembourg at 35%.
View image and data →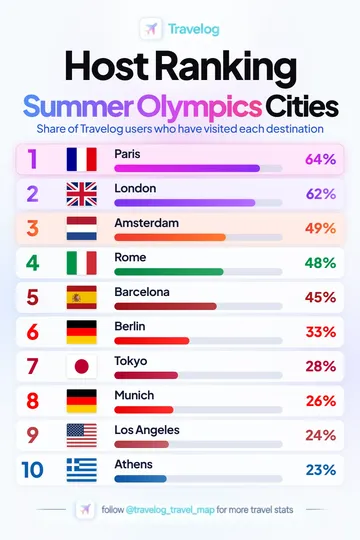
Paris is ranked first in this Travelog collection at 64%, followed by London at 62%.
View image and data →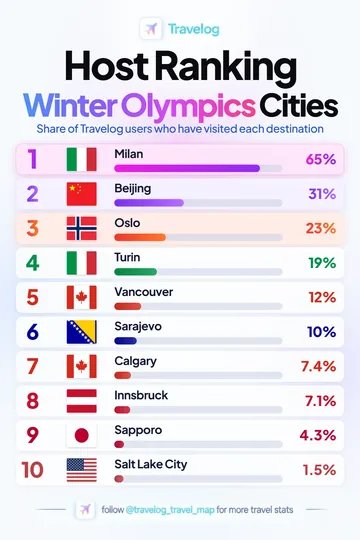
Milan is ranked first in this Travelog collection at 65%, followed by Beijing at 31%.
View image and data →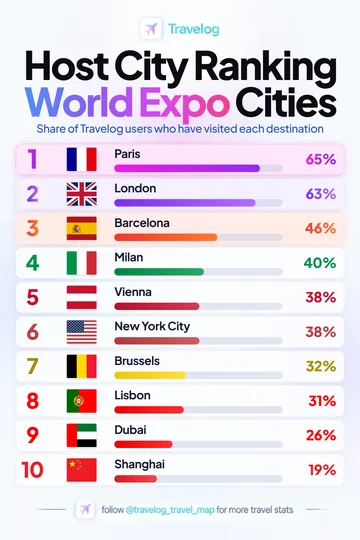
Paris is ranked first in this Travelog collection at 65%, followed by London at 63%.
View image and data →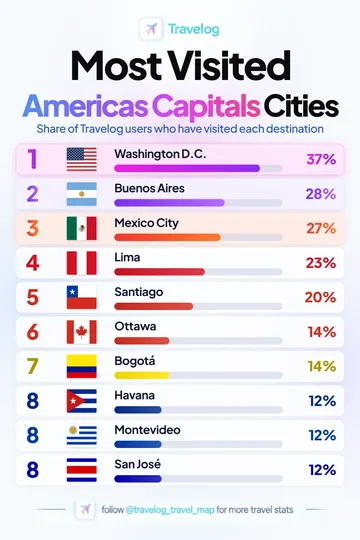
Washington D.C. is ranked first in this Travelog collection at 37%, followed by Buenos Aires at 28%.
View image and data →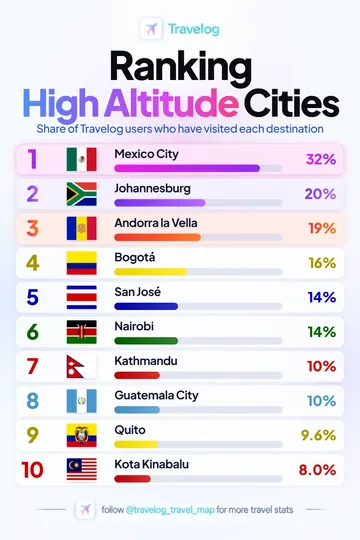
Mexico City is ranked first in this Travelog collection at 32%, followed by Johannesburg at 20%.
View image and data →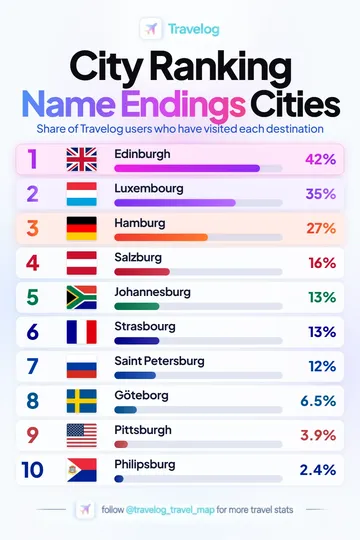
Edinburgh is ranked first in this Travelog collection at 42%, followed by Luxembourg at 35%.
View image and data →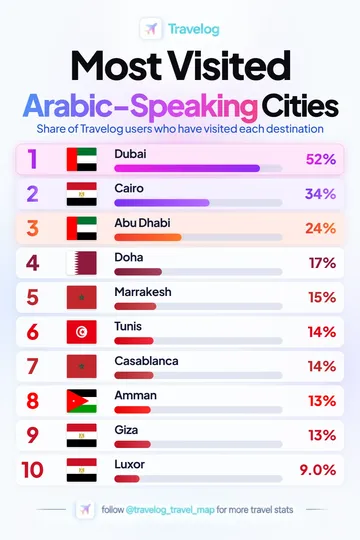
Dubai is ranked first in this Travelog collection at 52%, followed by Cairo at 34%.
View image and data →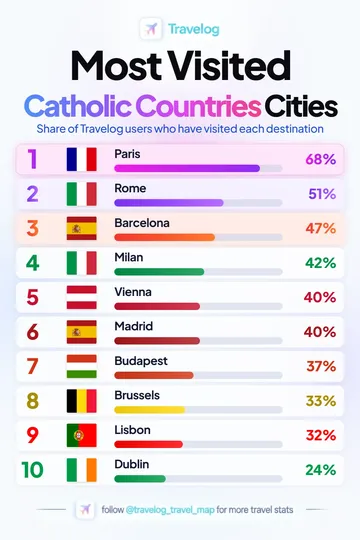
Paris is ranked first in this Travelog collection at 68%, followed by Rome at 51%.
View image and data →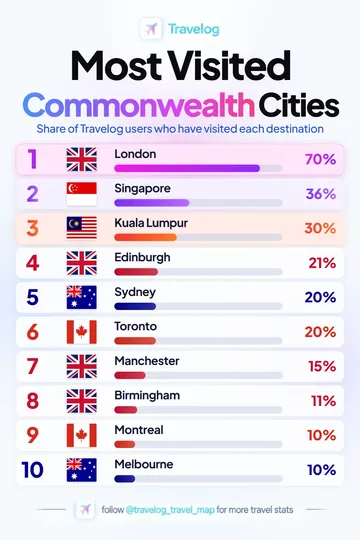
London is ranked first in this Travelog collection at 70%, followed by Singapore at 36%.
View image and data →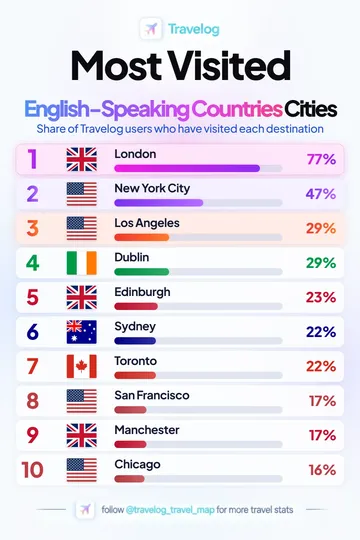
London is ranked first in this Travelog collection at 77%, followed by New York City at 47%.
View image and data →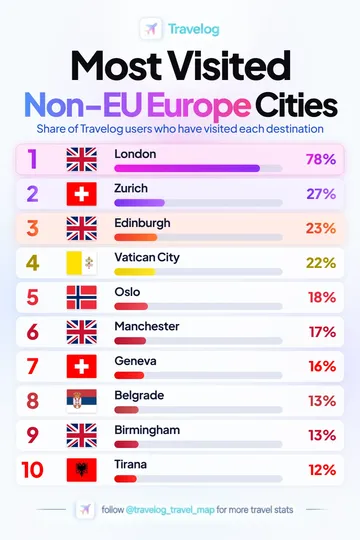
London is ranked first in this Travelog collection at 78%, followed by Zurich at 27%.
View image and data →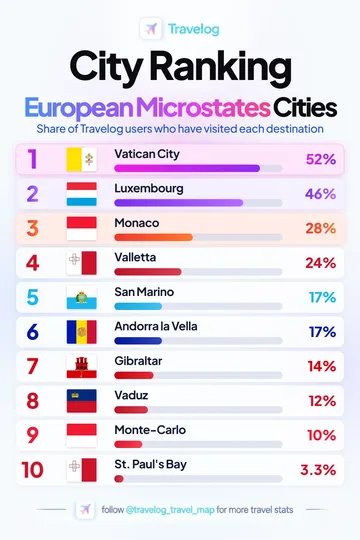
Vatican City is ranked first in this Travelog collection at 52%, followed by Luxembourg at 46%.
View image and data →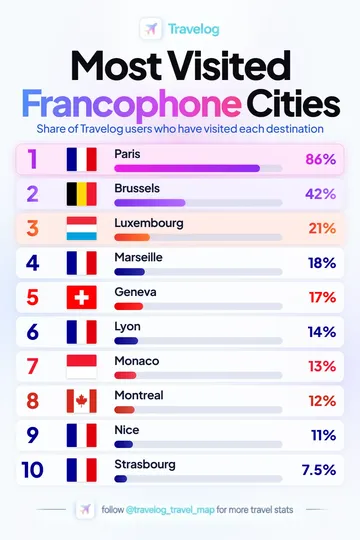
Paris is ranked first in this Travelog collection at 86%, followed by Brussels at 42%.
View image and data →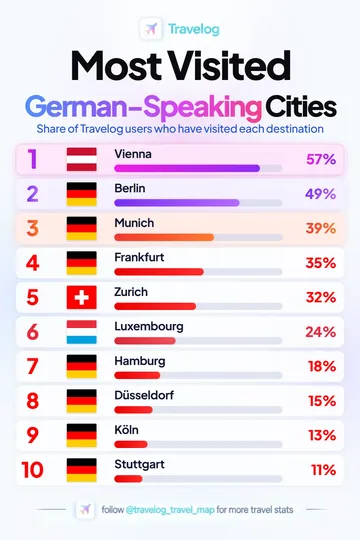
Vienna is ranked first in this Travelog collection at 57%, followed by Berlin at 49%.
View image and data →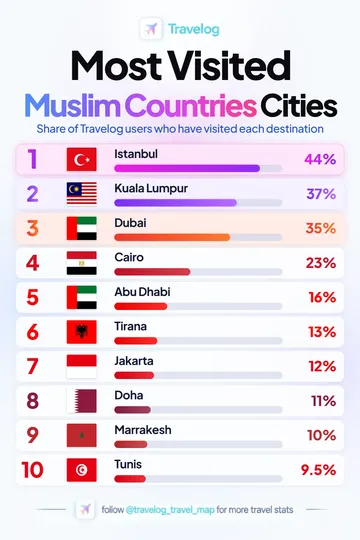
Istanbul is ranked first in this Travelog collection at 44%, followed by Kuala Lumpur at 37%.
View image and data →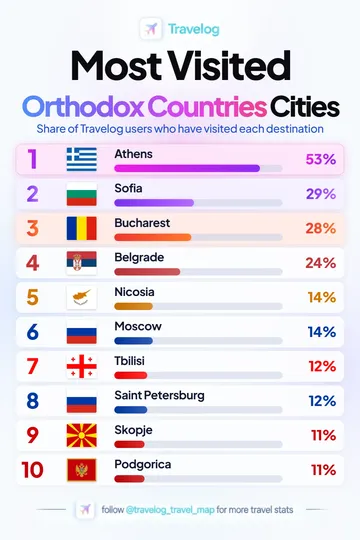
Athens is ranked first in this Travelog collection at 53%, followed by Sofia at 29%.
View image and data →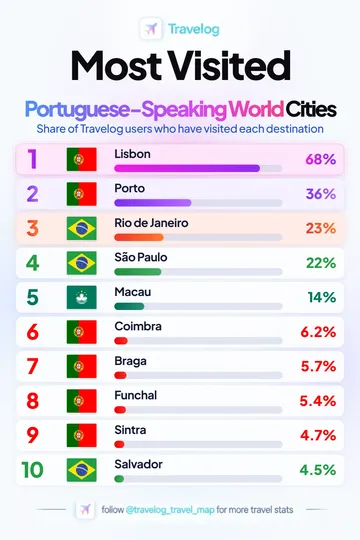
Lisbon is ranked first in this Travelog collection at 68%, followed by Porto at 36%.
View image and data →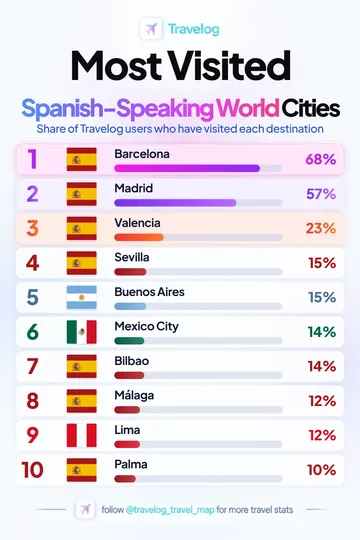
Barcelona is ranked first in this Travelog collection at 68%, followed by Madrid at 57%.
View image and data →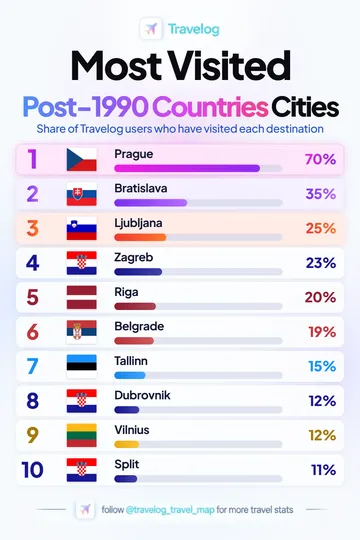
Prague is ranked first in this Travelog collection at 70%, followed by Bratislava at 35%.
View image and data →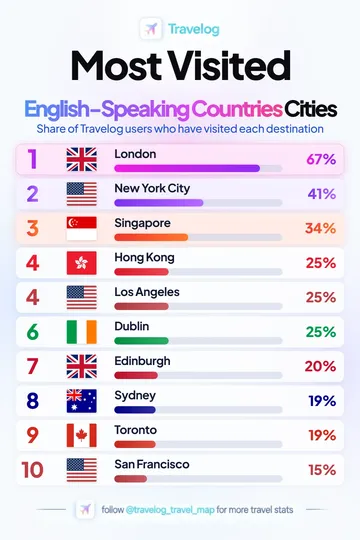
London is ranked first in this Travelog collection at 67%, followed by New York City at 41%.
View image and data →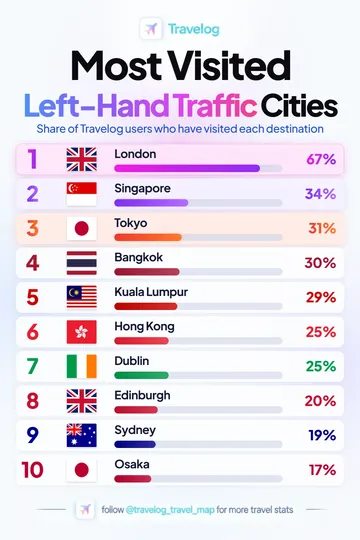
London is ranked first in this Travelog collection at 67%, followed by Singapore at 34%.
View image and data →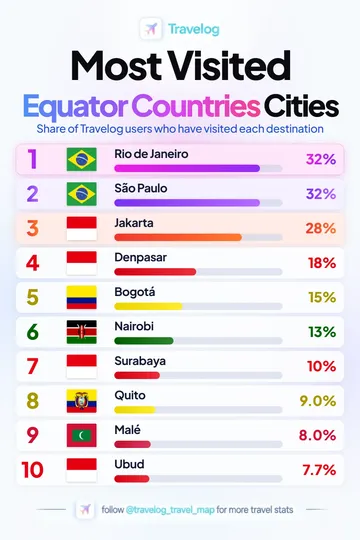
Rio de Janeiro is ranked first in this Travelog collection at 32%, followed by São Paulo at 32%.
View image and data →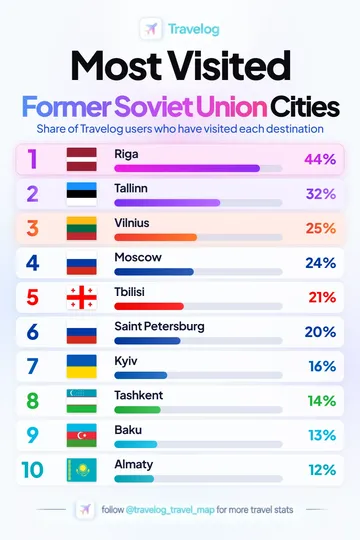
Riga is ranked first in this Travelog collection at 44%, followed by Tallinn at 32%.
View image and data →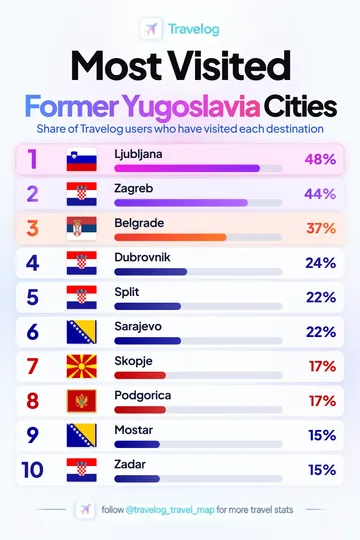
Ljubljana is ranked first in this Travelog collection at 48%, followed by Zagreb at 44%.
View image and data →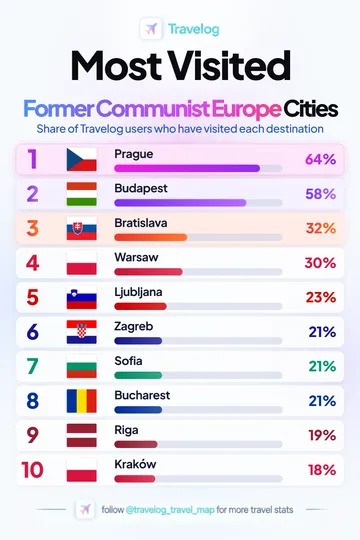
Prague is ranked first in this Travelog collection at 64%, followed by Budapest at 58%.
View image and data →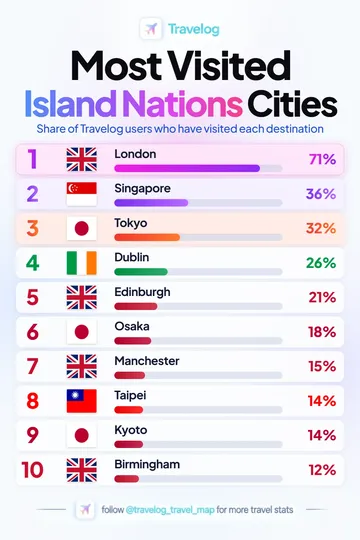
London is ranked first in this Travelog collection at 71%, followed by Singapore at 36%.
View image and data →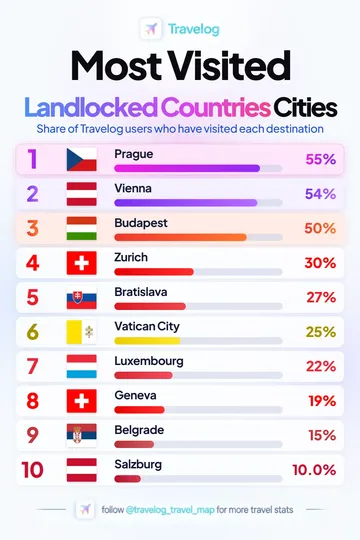
Prague is ranked first in this Travelog collection at 55%, followed by Vienna at 54%.
View image and data →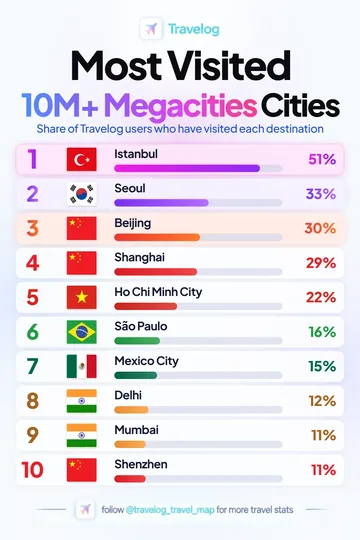
Istanbul is ranked first in this Travelog collection at 51%, followed by Seoul at 33%.
View image and data →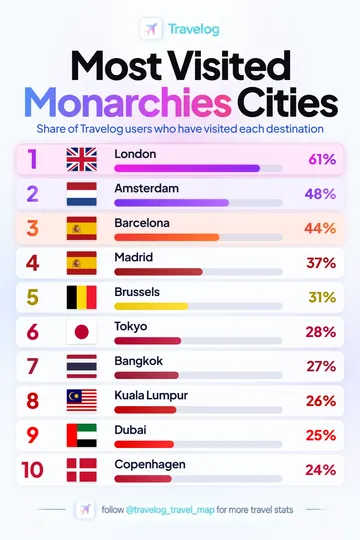
London is ranked first in this Travelog collection at 61%, followed by Amsterdam at 48%.
View image and data →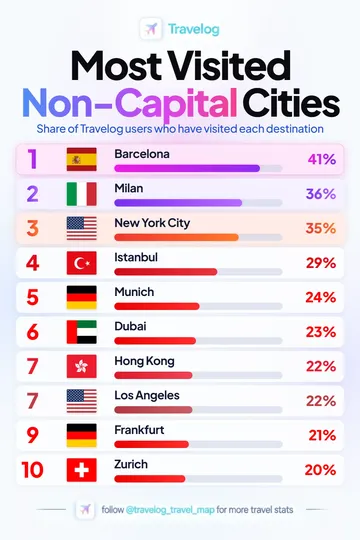
Barcelona is ranked first in this Travelog collection at 41%, followed by Milan at 36%.
View image and data →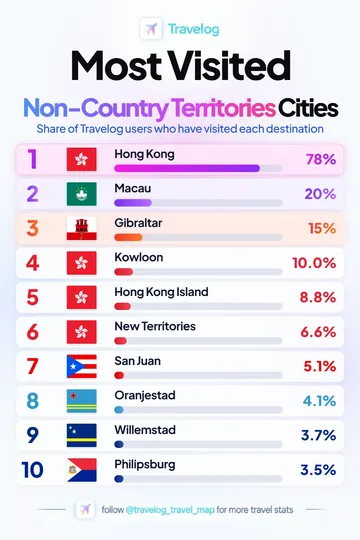
Hong Kong is ranked first in this Travelog collection at 78%, followed by Macau at 20%.
View image and data →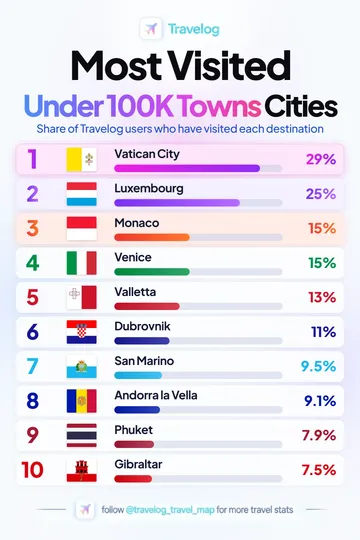
Vatican City is ranked first in this Travelog collection at 29%, followed by Luxembourg at 25%.
View image and data →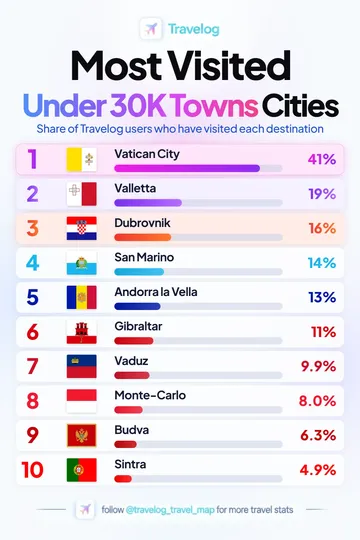
Vatican City is ranked first in this Travelog collection at 41%, followed by Valletta at 19%.
View image and data →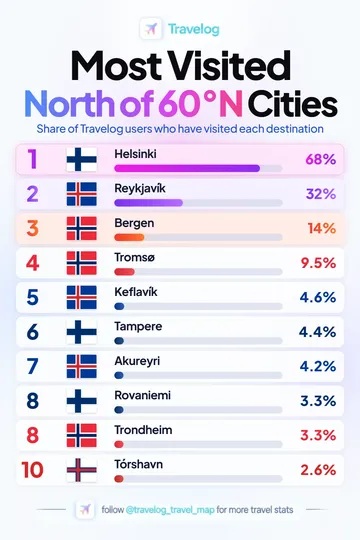
Helsinki is ranked first in this Travelog collection at 68%, followed by Reykjavík at 32%.
View image and data →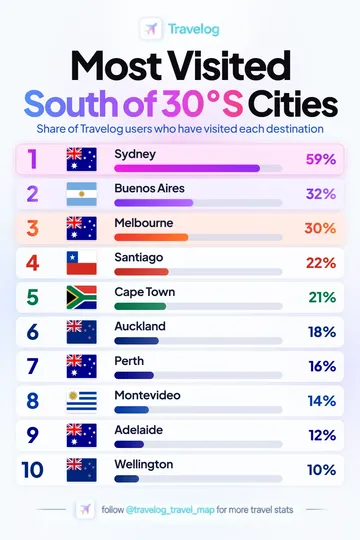
Sydney is ranked first in this Travelog collection at 59%, followed by Buenos Aires at 32%.
View image and data →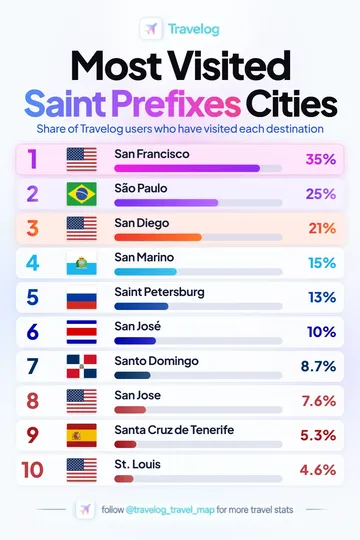
San Francisco is ranked first in this Travelog collection at 35%, followed by São Paulo at 25%.
View image and data →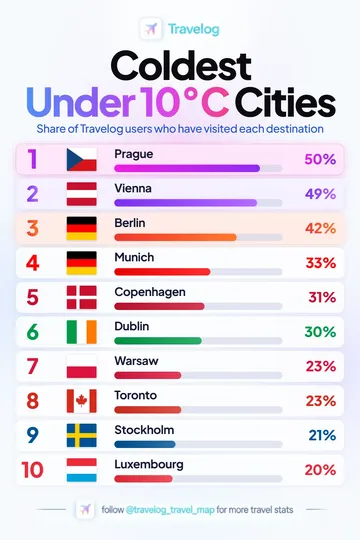
Prague is ranked first in this Travelog collection at 50%, followed by Vienna at 49%.
View image and data →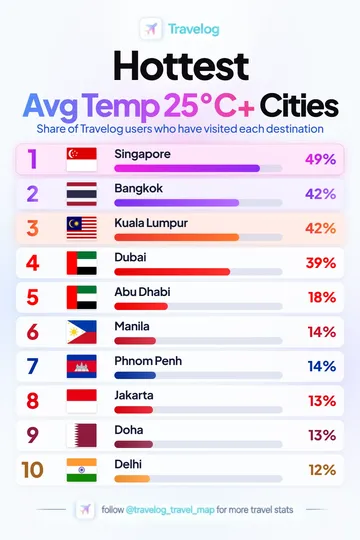
Singapore is ranked first in this Travelog collection at 49%, followed by Bangkok at 42%.
View image and data →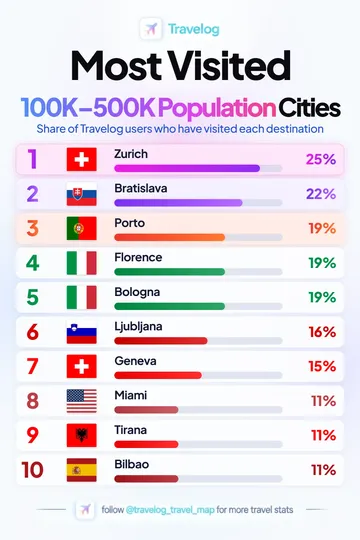
Zurich is ranked first in this Travelog collection at 25%, followed by Bratislava at 22%.
View image and data →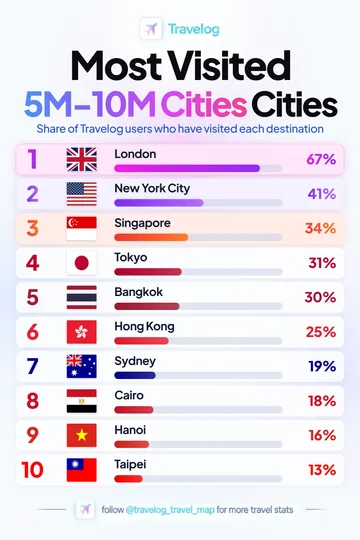
London is ranked first in this Travelog collection at 67%, followed by New York City at 41%.
View image and data →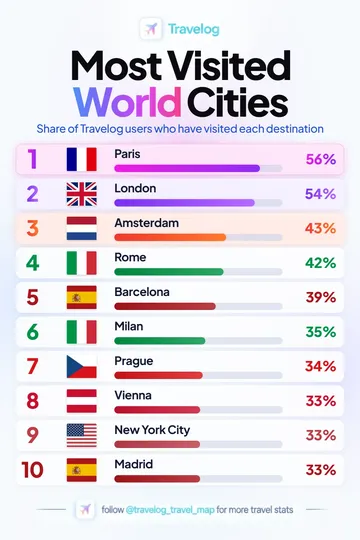
Paris is ranked first in this Travelog collection at 56%, followed by London at 54%.
View image and data →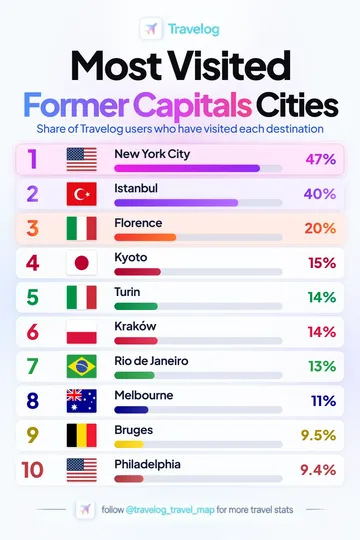
New York City is ranked first in this Travelog collection at 47%, followed by Istanbul at 40%.
View image and data →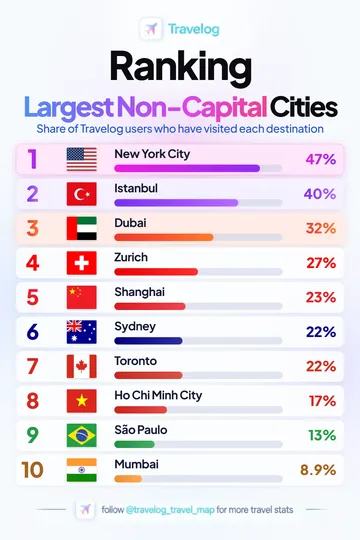
New York City is ranked first in this Travelog collection at 47%, followed by Istanbul at 40%.
View image and data →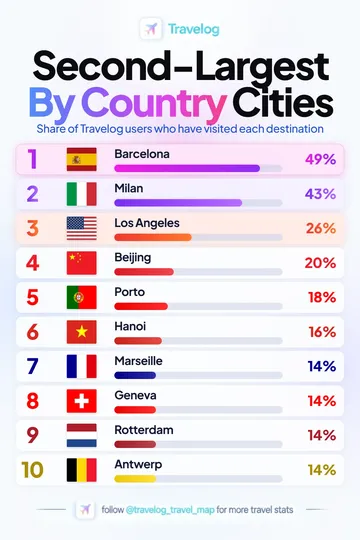
Barcelona is ranked first in this Travelog collection at 49%, followed by Milan at 43%.
View image and data →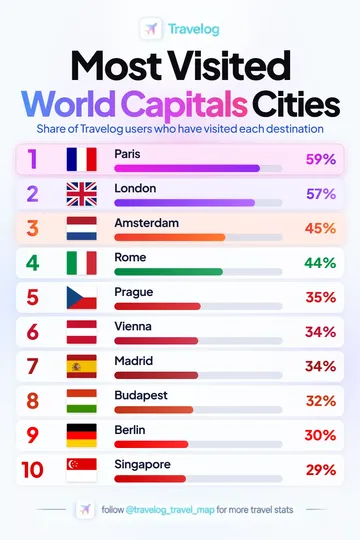
Paris is ranked first in this Travelog collection at 59%, followed by London at 57%.
View image and data →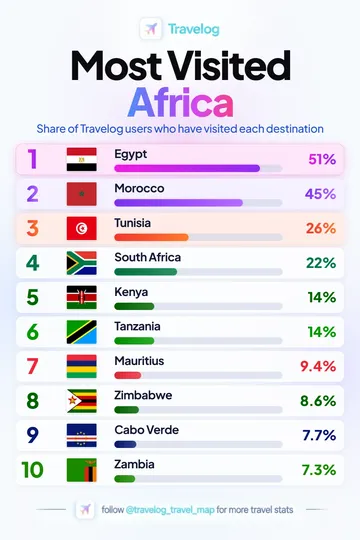
Egypt is ranked first in this Travelog collection at 51%, followed by Morocco at 45%.
View image and data →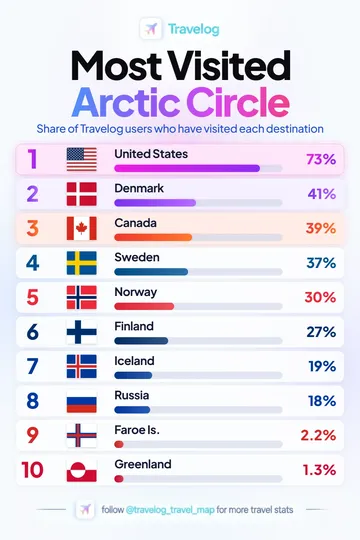
United States is ranked first in this Travelog collection at 73%, followed by Denmark at 41%.
View image and data →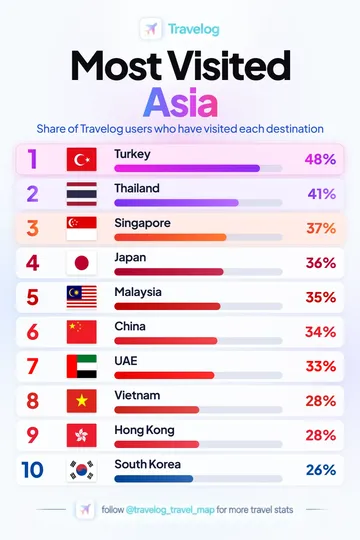
Turkey is ranked first in this Travelog collection at 48%, followed by Thailand at 41%.
View image and data →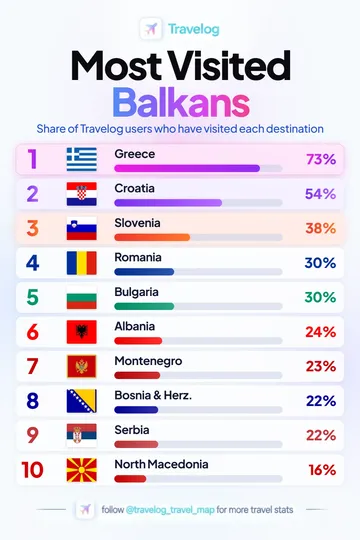
Greece is ranked first in this Travelog collection at 73%, followed by Croatia at 54%.
View image and data →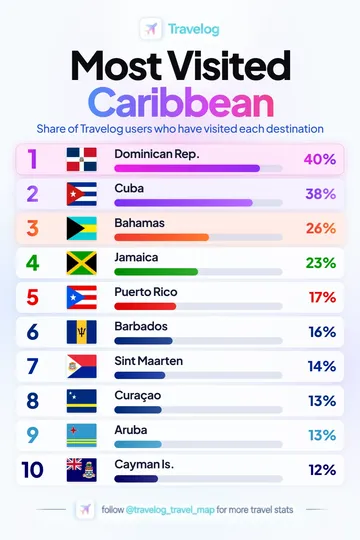
Dominican Rep. is ranked first in this Travelog collection at 40%, followed by Cuba at 38%.
View image and data →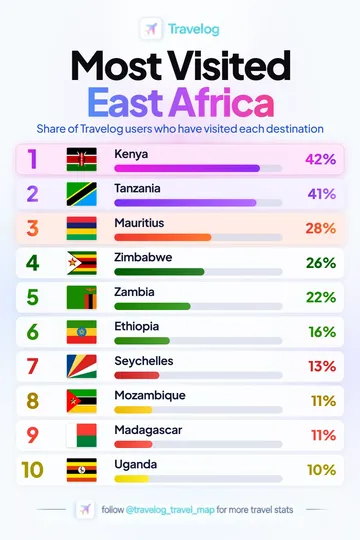
Kenya is ranked first in this Travelog collection at 42%, followed by Tanzania at 41%.
View image and data →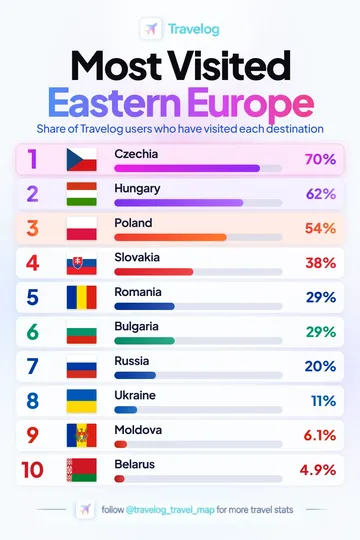
Czechia is ranked first in this Travelog collection at 70%, followed by Hungary at 62%.
View image and data →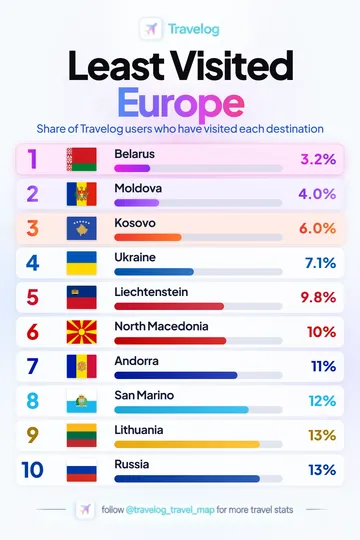
Belarus is ranked first in this Travelog collection at 3.2%, followed by Moldova at 4%.
View image and data →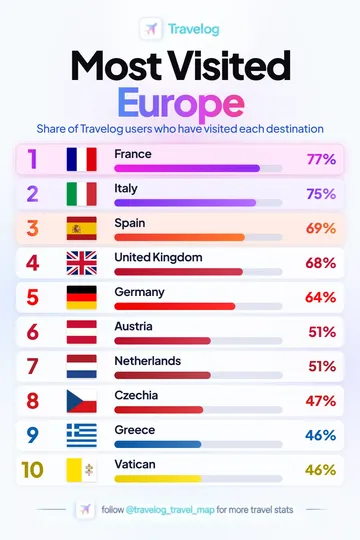
France is ranked first in this Travelog collection at 77%, followed by Italy at 75%.
View image and data →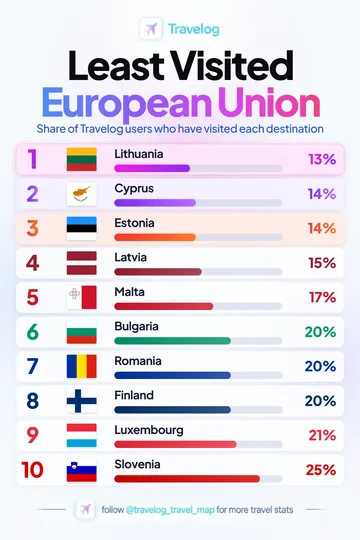
Lithuania is ranked first in this Travelog collection at 13%, followed by Cyprus at 14%.
View image and data →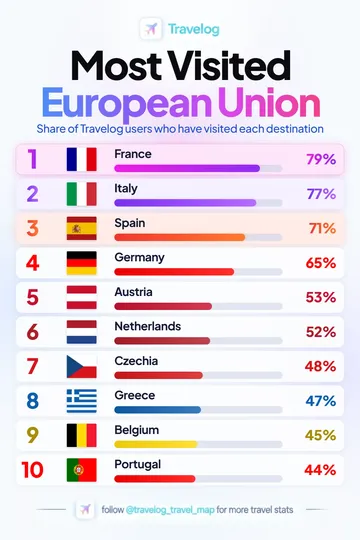
France is ranked first in this Travelog collection at 79%, followed by Italy at 77%.
View image and data →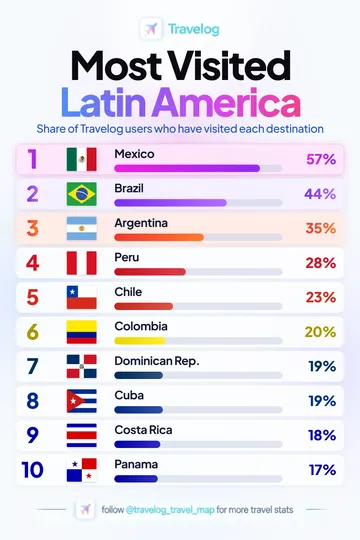
Mexico is ranked first in this Travelog collection at 57%, followed by Brazil at 44%.
View image and data →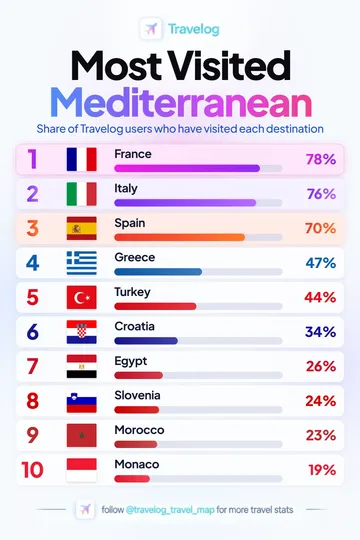
France is ranked first in this Travelog collection at 78%, followed by Italy at 76%.
View image and data →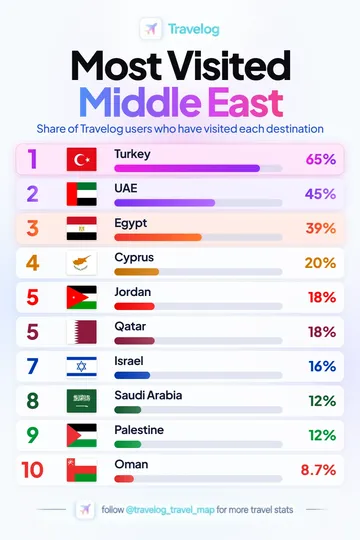
Turkey is ranked first in this Travelog collection at 65%, followed by UAE at 45%.
View image and data →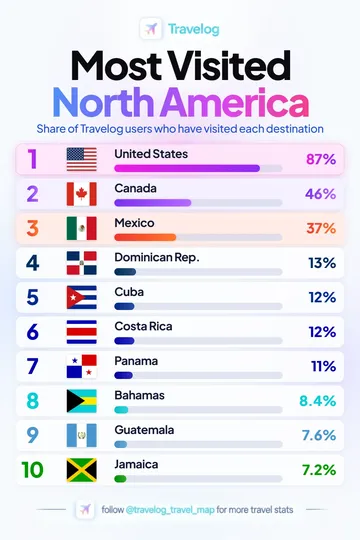
United States is ranked first in this Travelog collection at 87%, followed by Canada at 46%.
View image and data →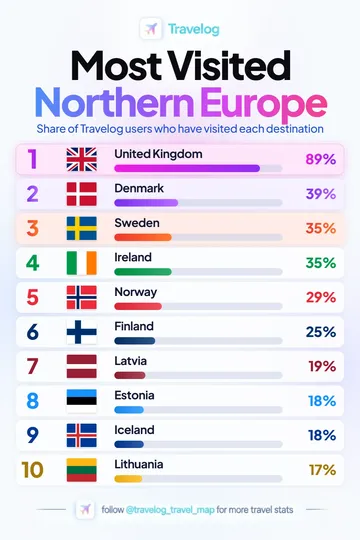
United Kingdom is ranked first in this Travelog collection at 89%, followed by Denmark at 39%.
View image and data →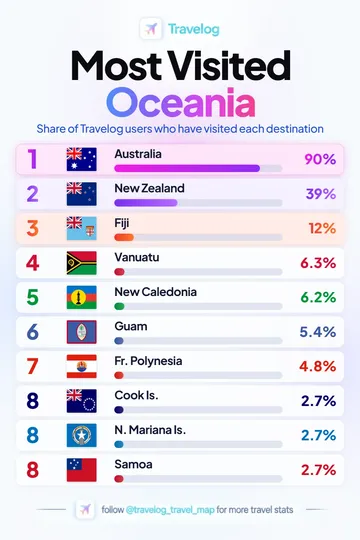
Australia is ranked first in this Travelog collection at 90%, followed by New Zealand at 39%.
View image and data →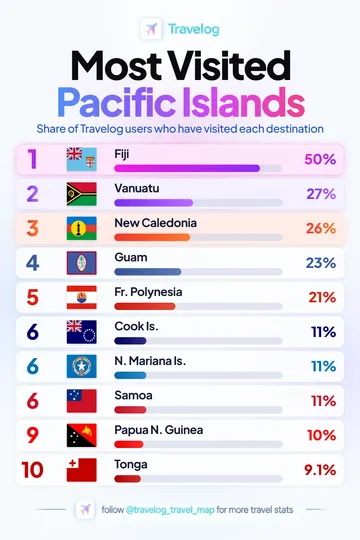
Fiji is ranked first in this Travelog collection at 50%, followed by Vanuatu at 27%.
View image and data →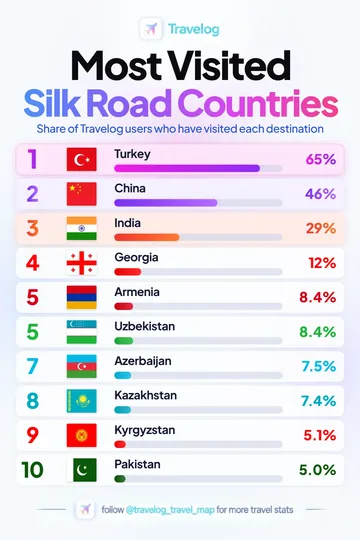
Turkey is ranked first in this Travelog collection at 65%, followed by China at 46%.
View image and data →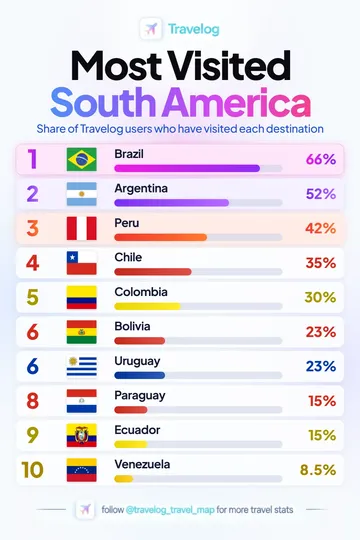
Brazil is ranked first in this Travelog collection at 66%, followed by Argentina at 52%.
View image and data →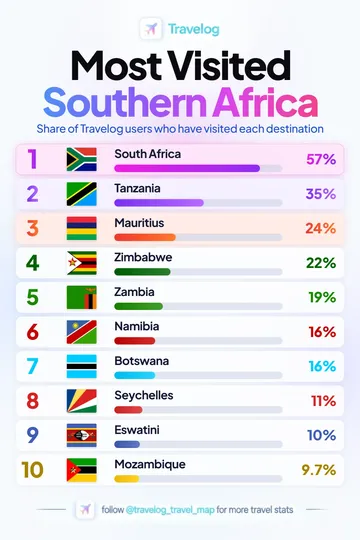
South Africa is ranked first in this Travelog collection at 57%, followed by Tanzania at 35%.
View image and data →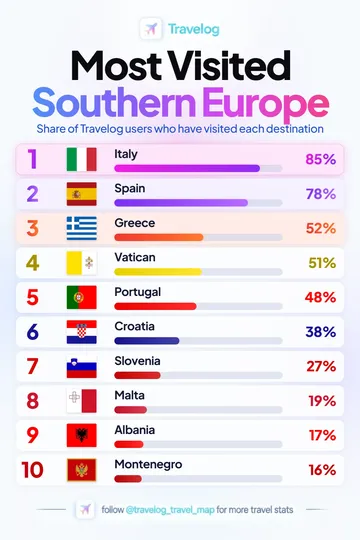
Italy is ranked first in this Travelog collection at 85%, followed by Spain at 78%.
View image and data →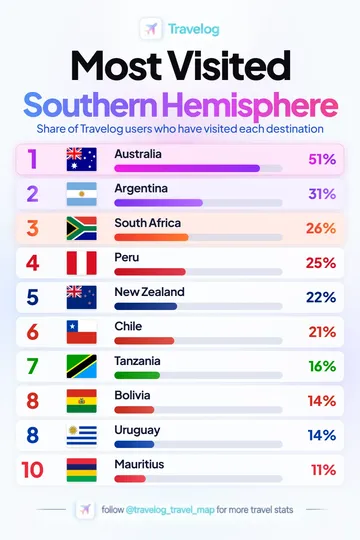
Australia is ranked first in this Travelog collection at 51%, followed by Argentina at 31%.
View image and data →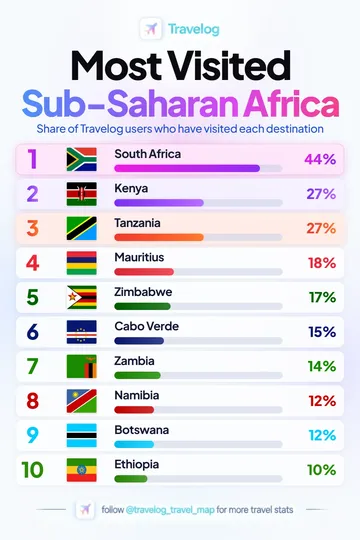
South Africa is ranked first in this Travelog collection at 44%, followed by Kenya at 27%.
View image and data →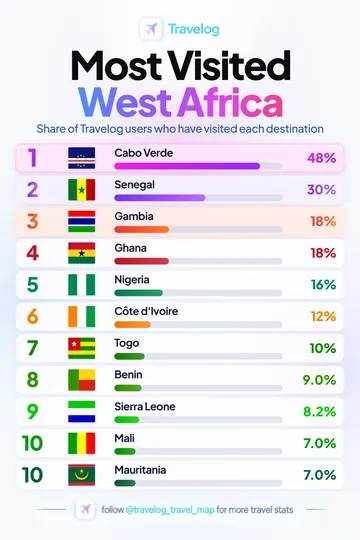
Cabo Verde is ranked first in this Travelog collection at 48%, followed by Senegal at 30%.
View image and data →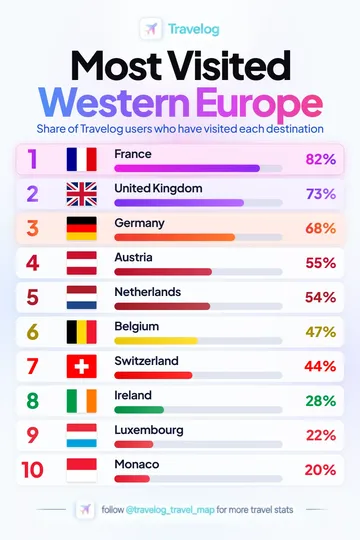
France is ranked first in this Travelog collection at 82%, followed by United Kingdom at 73%.
View image and data →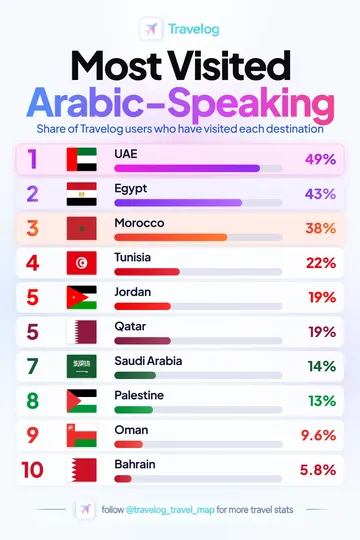
UAE is ranked first in this Travelog collection at 49%, followed by Egypt at 43%.
View image and data →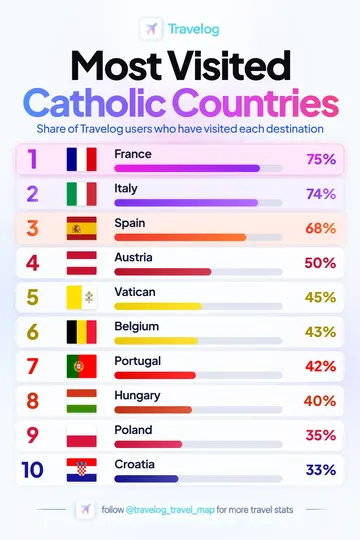
France is ranked first in this Travelog collection at 75%, followed by Italy at 74%.
View image and data →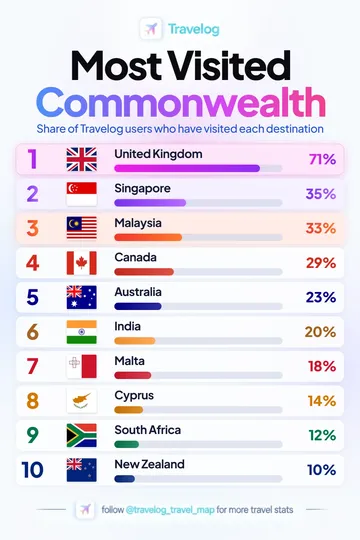
United Kingdom is ranked first in this Travelog collection at 71%, followed by Singapore at 35%.
View image and data →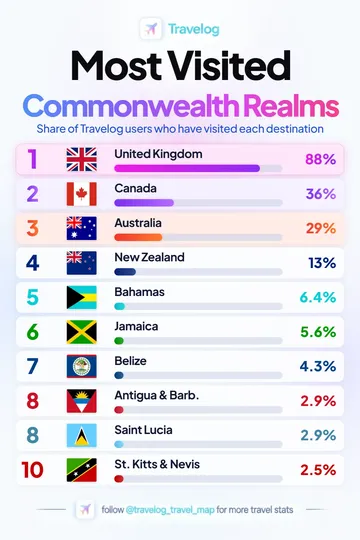
United Kingdom is ranked first in this Travelog collection at 88%, followed by Canada at 36%.
View image and data →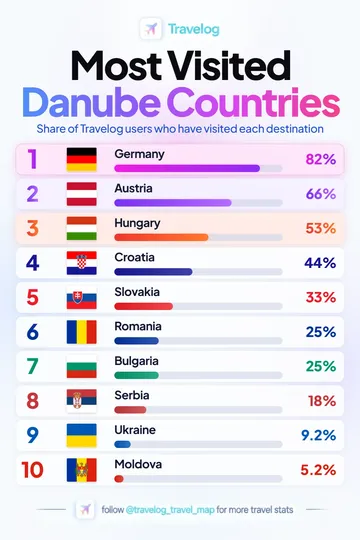
Germany is ranked first in this Travelog collection at 82%, followed by Austria at 66%.
View image and data →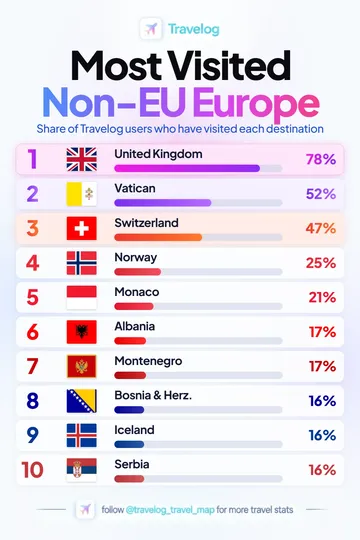
United Kingdom is ranked first in this Travelog collection at 78%, followed by Vatican at 52%.
View image and data →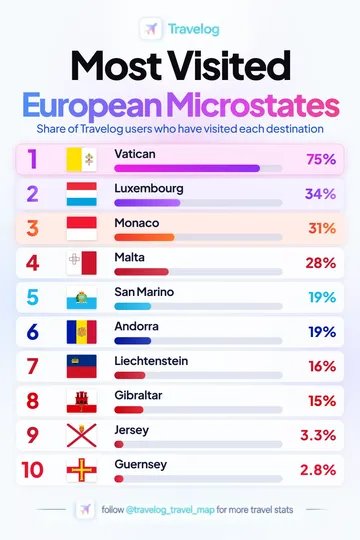
Vatican is ranked first in this Travelog collection at 75%, followed by Luxembourg at 34%.
View image and data →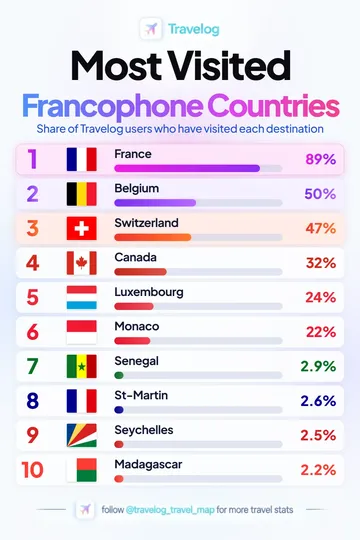
France is ranked first in this Travelog collection at 89%, followed by Belgium at 50%.
View image and data →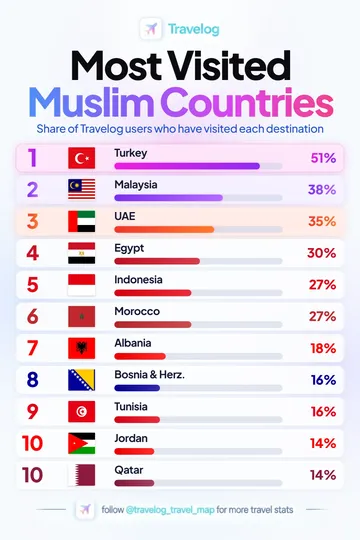
Turkey is ranked first in this Travelog collection at 51%, followed by Malaysia at 38%.
View image and data →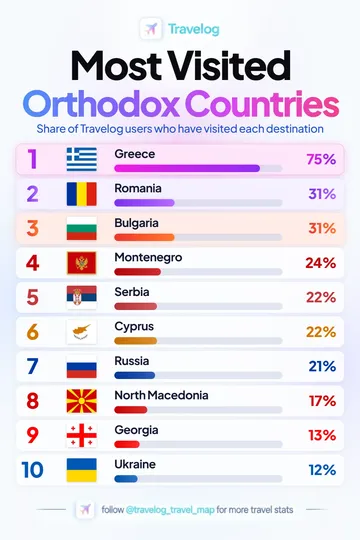
Greece is ranked first in this Travelog collection at 75%, followed by Romania at 31%.
View image and data →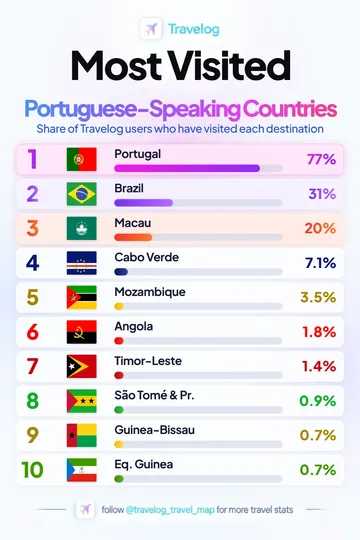
Portugal is ranked first in this Travelog collection at 77%, followed by Brazil at 31%.
View image and data →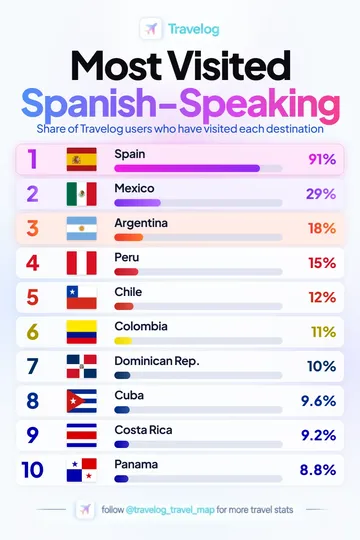
Spain is ranked first in this Travelog collection at 91%, followed by Mexico at 29%.
View image and data →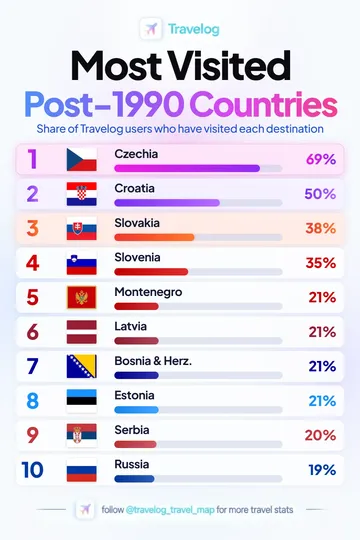
Czechia is ranked first in this Travelog collection at 69%, followed by Croatia at 50%.
View image and data →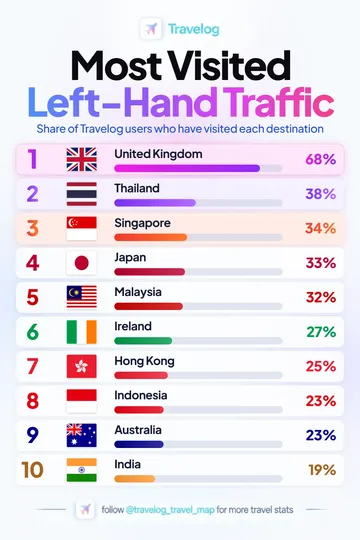
United Kingdom is ranked first in this Travelog collection at 68%, followed by Thailand at 38%.
View image and data →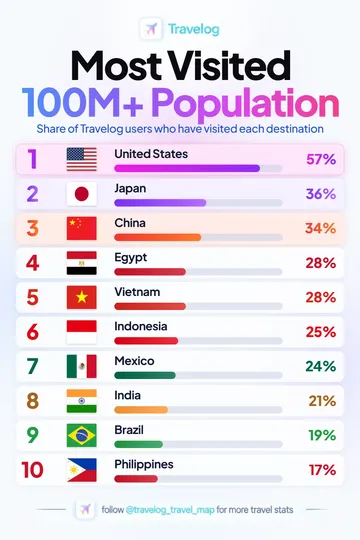
United States is ranked first in this Travelog collection at 57%, followed by Japan at 36%.
View image and data →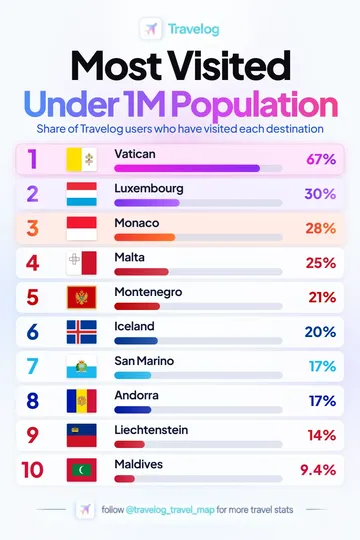
Vatican is ranked first in this Travelog collection at 67%, followed by Luxembourg at 30%.
View image and data →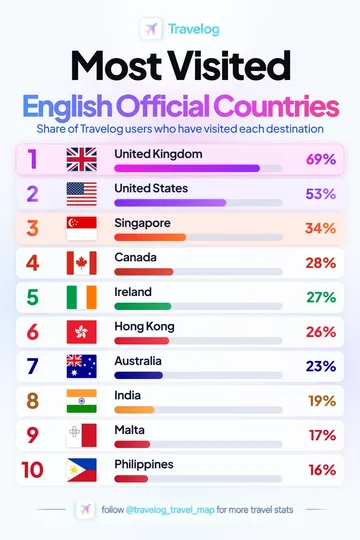
United Kingdom is ranked first in this Travelog collection at 69%, followed by United States at 53%.
View image and data →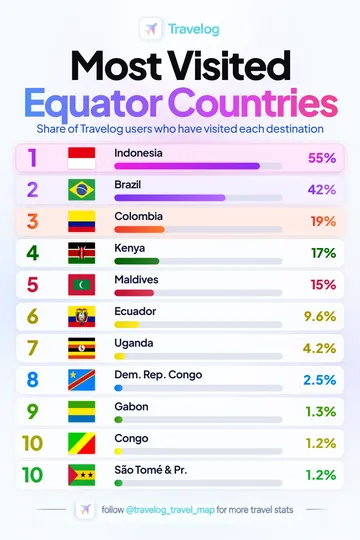
Indonesia is ranked first in this Travelog collection at 55%, followed by Brazil at 42%.
View image and data →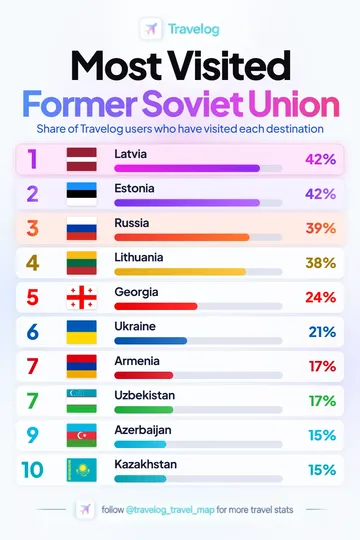
Latvia is ranked first in this Travelog collection at 42%, followed by Estonia at 42%.
View image and data →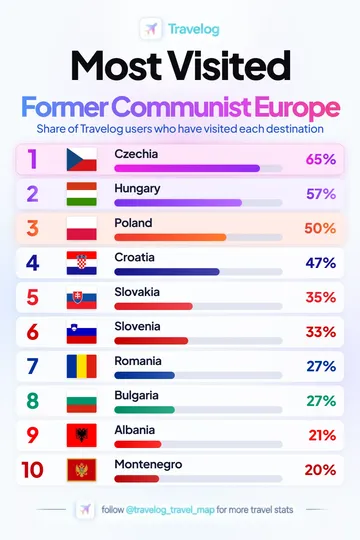
Czechia is ranked first in this Travelog collection at 65%, followed by Hungary at 57%.
View image and data →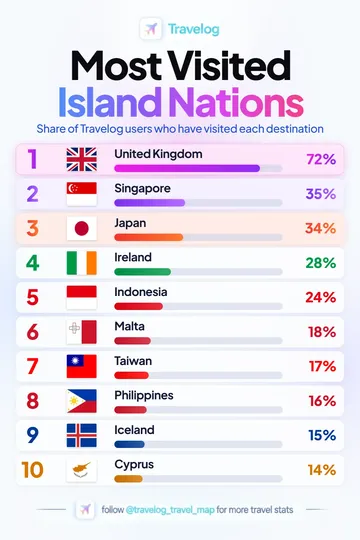
United Kingdom is ranked first in this Travelog collection at 72%, followed by Singapore at 35%.
View image and data →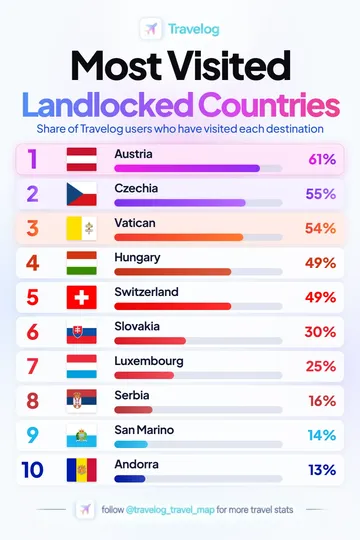
Austria is ranked first in this Travelog collection at 61%, followed by Czechia at 55%.
View image and data →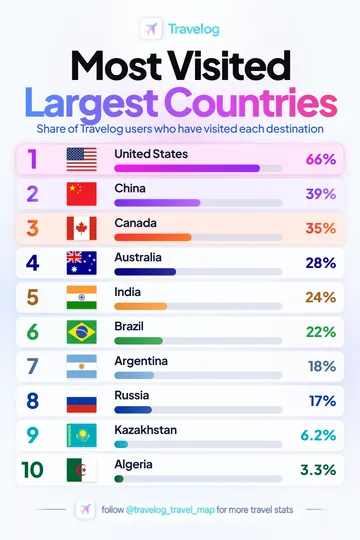
United States is ranked first in this Travelog collection at 66%, followed by China at 39%.
View image and data →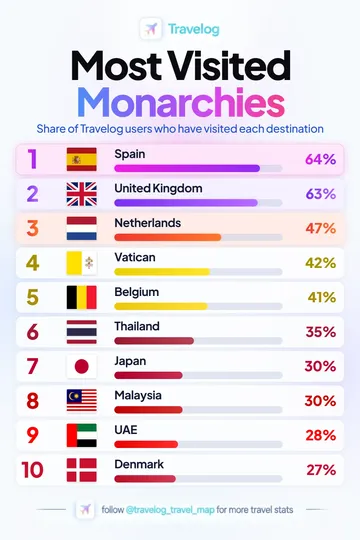
Spain is ranked first in this Travelog collection at 64%, followed by United Kingdom at 63%.
View image and data →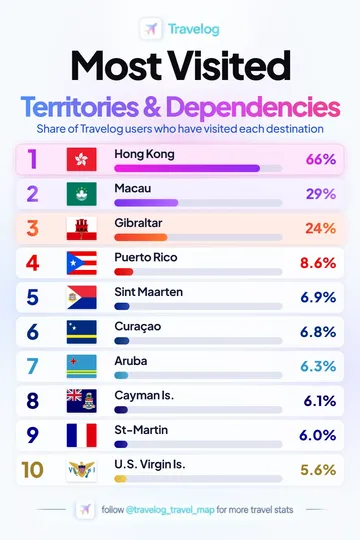
Hong Kong is ranked first in this Travelog collection at 66%, followed by Macau at 29%.
View image and data →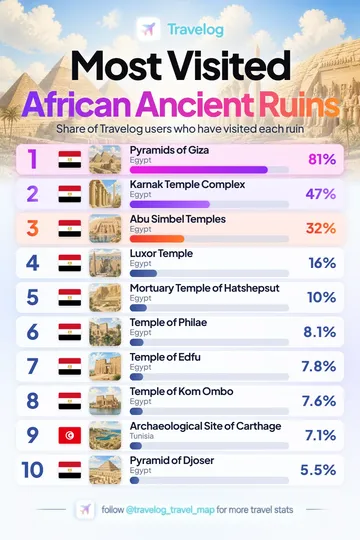
Pyramids of Giza leads this Travelog ancient ruins collection at 81%, followed by Karnak Temple Complex at 47%.
View image and data →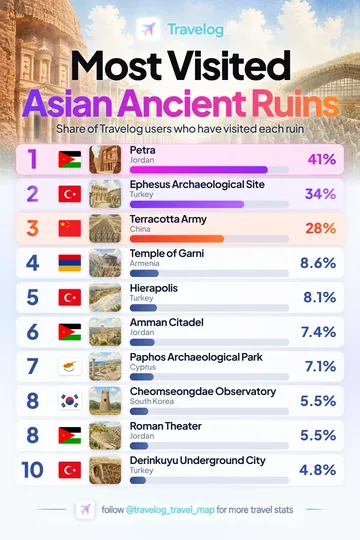
Petra leads this Travelog ancient ruins collection at 41%, followed by Ephesus Archaeological Site at 34%.
View image and data →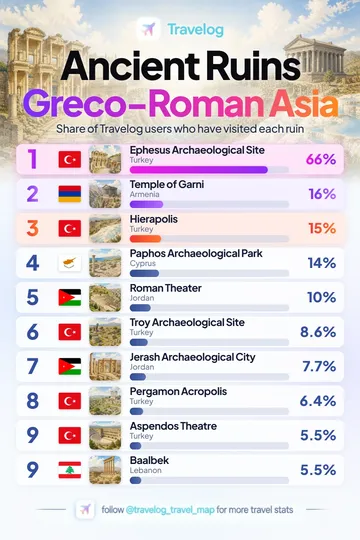
Ephesus Archaeological Site leads this Travelog greek & roman ruins collection at 66%, followed by Temple of Garni at 16%.
View image and data →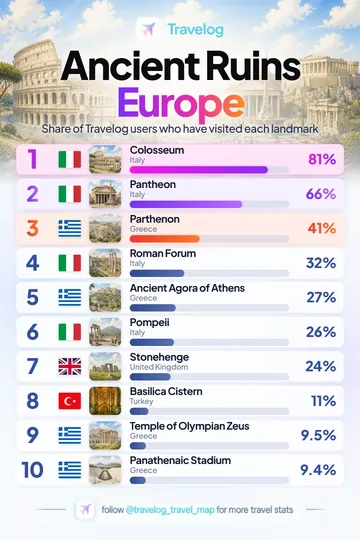
Colosseum leads this Travelog ancient ruins collection at 81%, followed by Pantheon at 66%.
View image and data →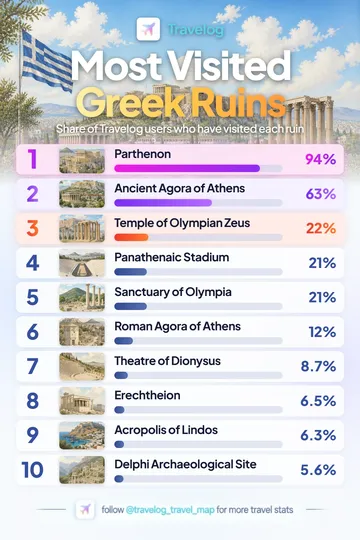
Parthenon leads this Travelog ancient ruins collection at 94%, followed by Ancient Agora of Athens at 63%.
View image and data →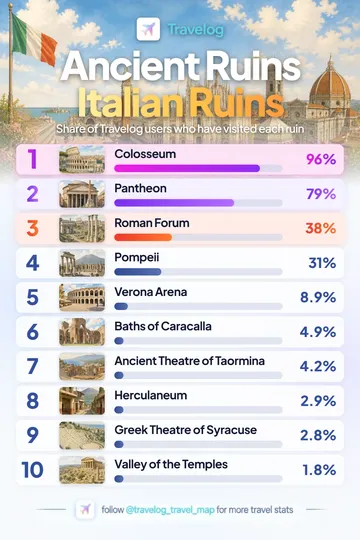
Colosseum leads this Travelog ancient ruins collection at 96%, followed by Pantheon at 79%.
View image and data →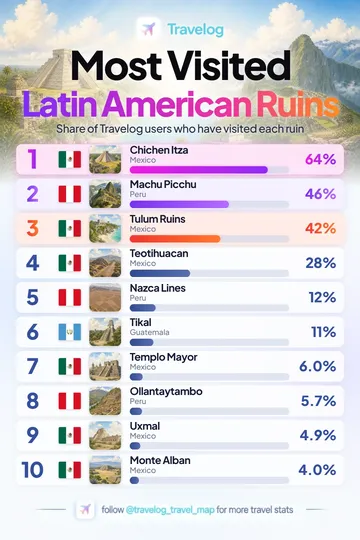
Chichen Itza leads this Travelog ancient ruins collection at 64%, followed by Machu Picchu at 46%.
View image and data →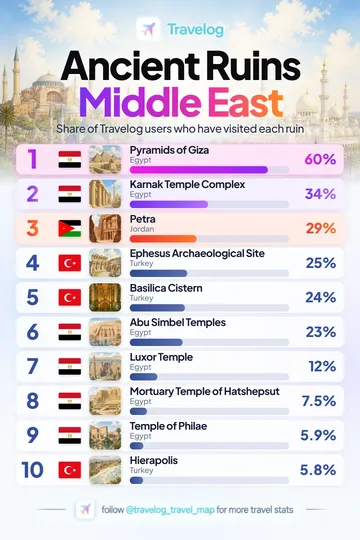
Pyramids of Giza leads this Travelog ancient ruins collection at 60%, followed by Karnak Temple Complex at 34%.
View image and data →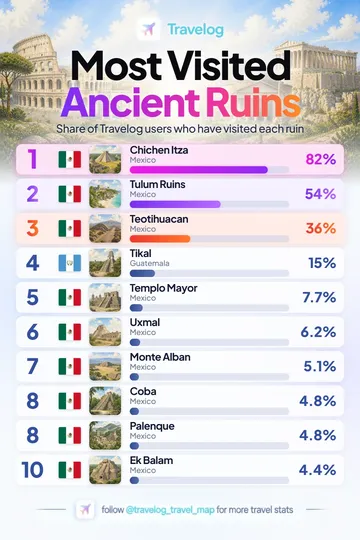
Chichen Itza leads this Travelog ancient ruins collection at 82%, followed by Tulum Ruins at 54%.
View image and data →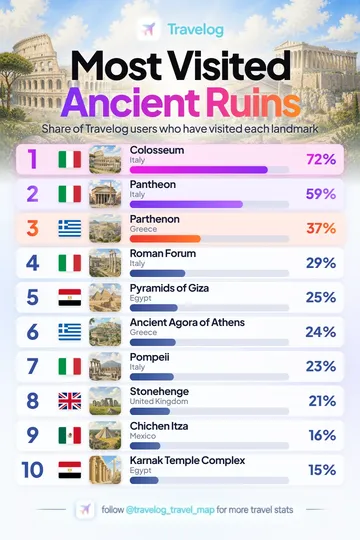
Colosseum leads this Travelog ancient ruins collection at 72%, followed by Pantheon at 59%.
View image and data →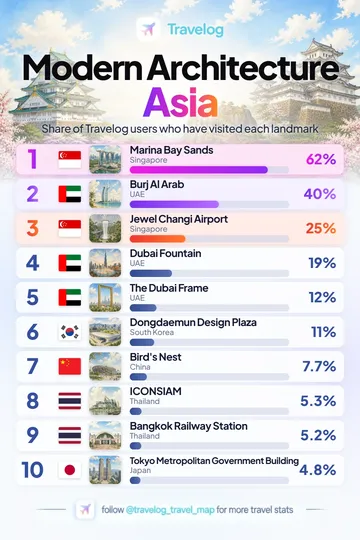
Marina Bay Sands leads this Travelog modern architecture collection at 62%, followed by Burj Al Arab at 40%.
View image and data →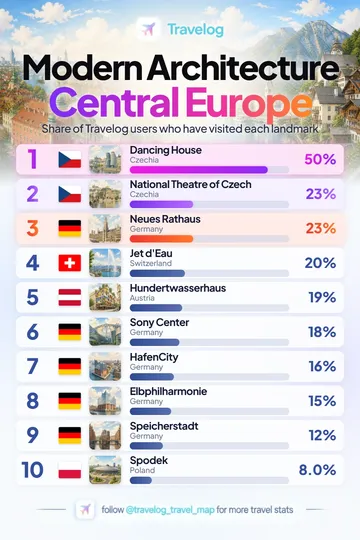
Dancing House leads this Travelog modern architecture collection at 50%, followed by National Theatre of Czech at 23%.
View image and data →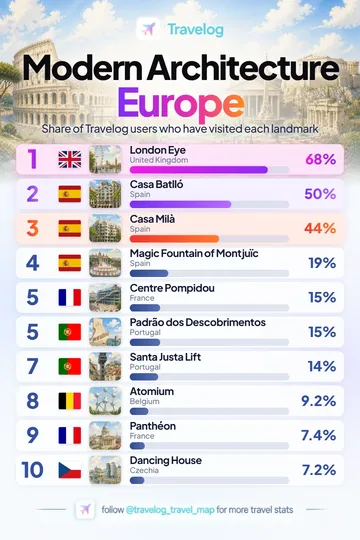
London Eye leads this Travelog modern architecture collection at 68%, followed by Casa Batlló at 50%.
View image and data →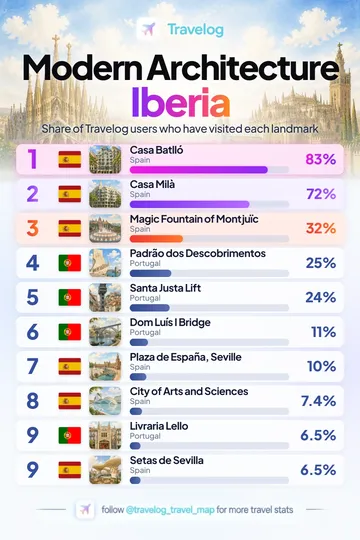
Casa Batlló leads this Travelog modern architecture collection at 83%, followed by Casa Milà at 72%.
View image and data →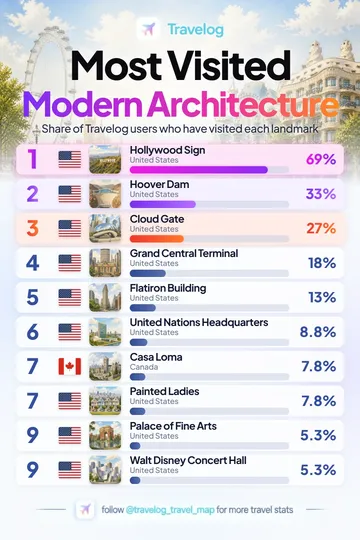
Hollywood Sign leads this Travelog modern architecture collection at 69%, followed by Hoover Dam at 33%.
View image and data →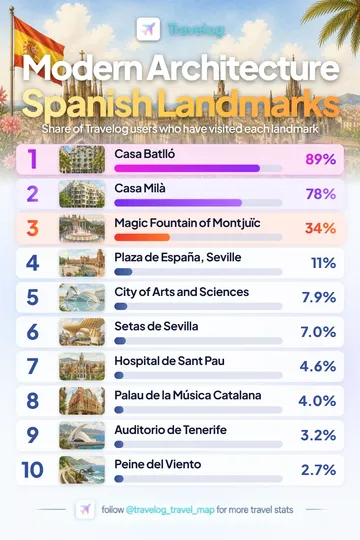
Casa Batlló leads this Travelog modern architecture collection at 89%, followed by Casa Milà at 78%.
View image and data →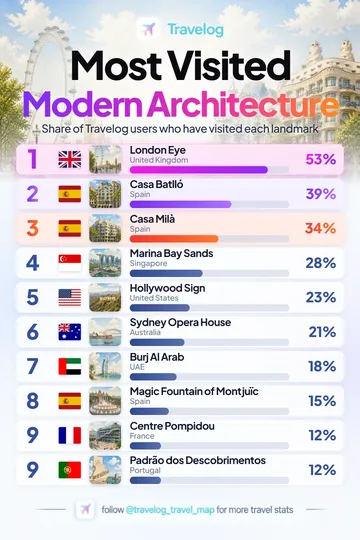
London Eye leads this Travelog modern architecture collection at 53%, followed by Casa Batlló at 39%.
View image and data →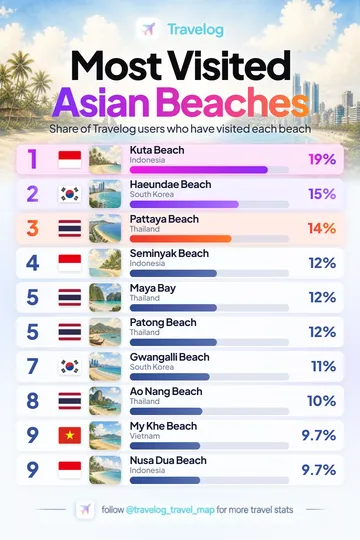
Kuta Beach leads this Travelog beaches collection at 19%, followed by Haeundae Beach at 15%.
View image and data →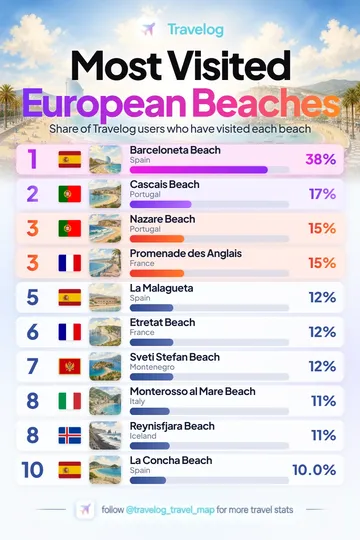
Barceloneta Beach leads this Travelog beaches collection at 38%, followed by Cascais Beach at 17%.
View image and data →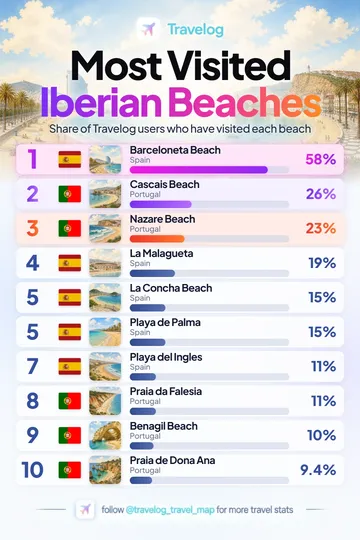
Barceloneta Beach leads this Travelog beaches collection at 58%, followed by Cascais Beach at 26%.
View image and data →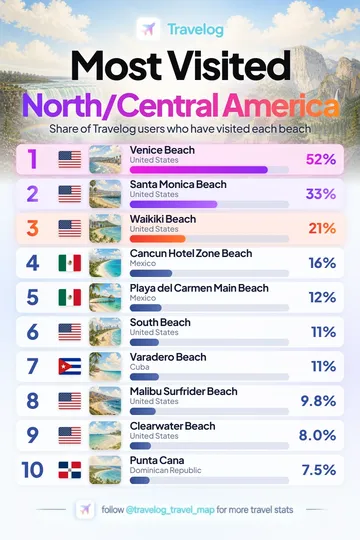
Venice Beach leads this Travelog beaches collection at 52%, followed by Santa Monica Beach at 33%.
View image and data →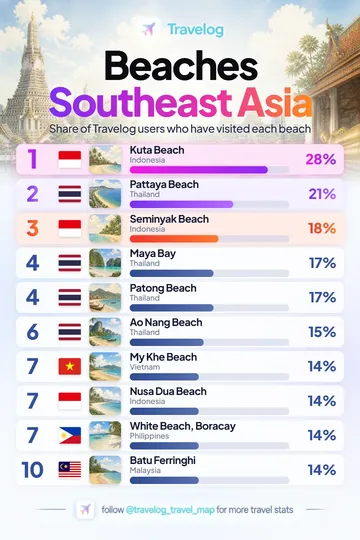
Kuta Beach leads this Travelog beaches collection at 28%, followed by Pattaya Beach at 21%.
View image and data →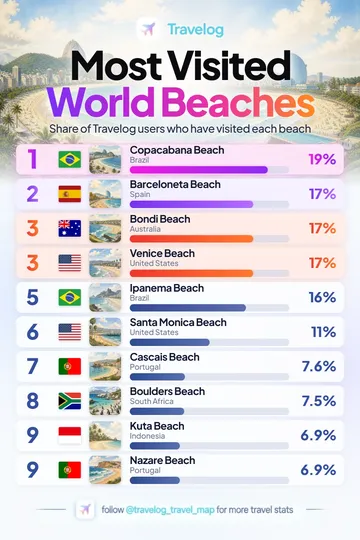
Copacabana Beach leads this Travelog beaches collection at 19%, followed by Barceloneta Beach at 17%.
View image and data →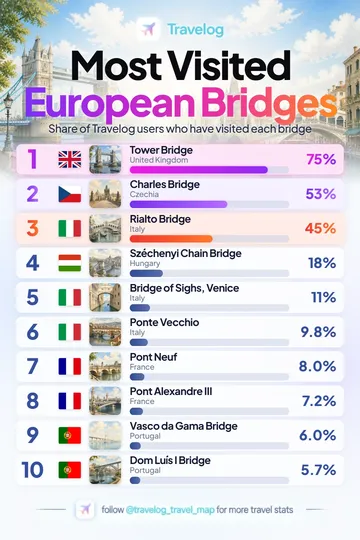
Tower Bridge leads this Travelog bridges collection at 75%, followed by Charles Bridge at 53%.
View image and data →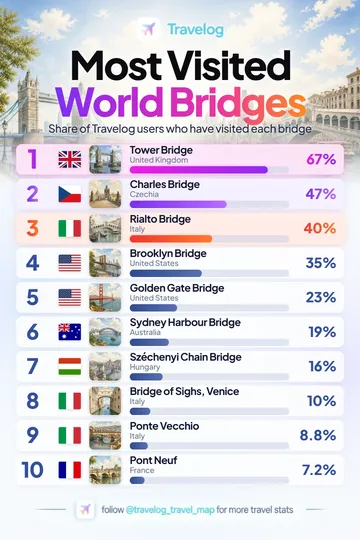
Tower Bridge leads this Travelog bridges collection at 67%, followed by Charles Bridge at 47%.
View image and data →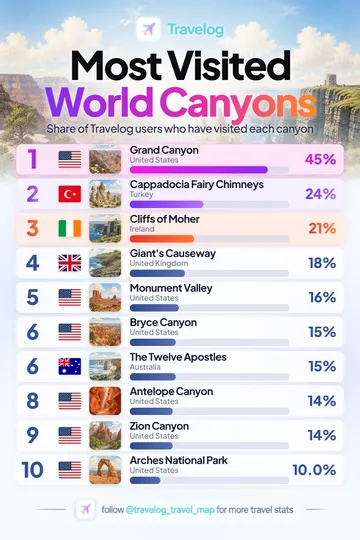
Grand Canyon leads this Travelog canyons collection at 45%, followed by Cappadocia Fairy Chimneys at 24%.
View image and data →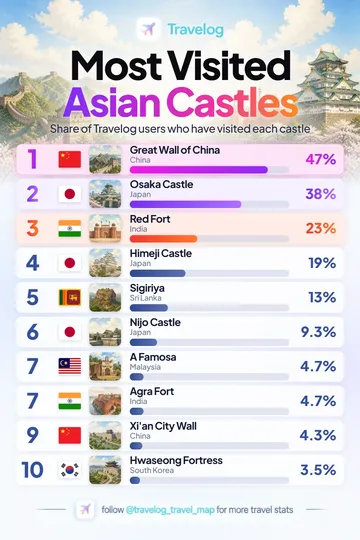
Great Wall of China leads this Travelog castles & fortresses collection at 47%, followed by Osaka Castle at 38%.
View image and data →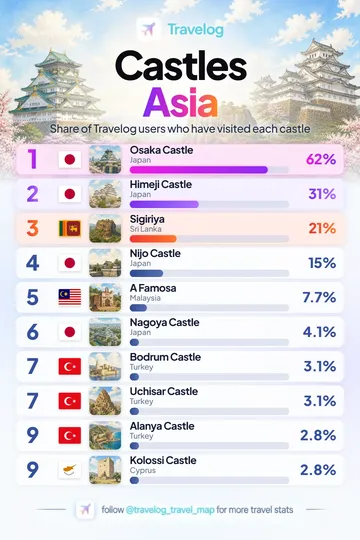
Osaka Castle leads this Travelog castles collection at 62%, followed by Himeji Castle at 31%.
View image and data →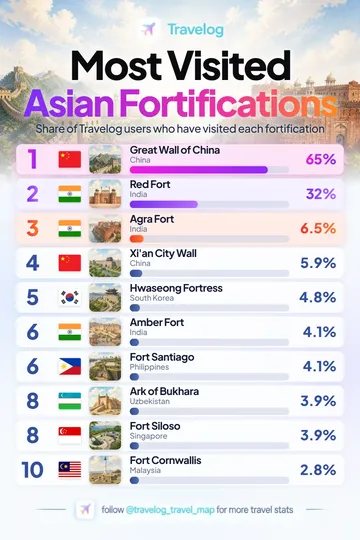
Great Wall of China leads this Travelog fortresses, walls & defensive towers collection at 65%, followed by Red Fort at 32%.
View image and data →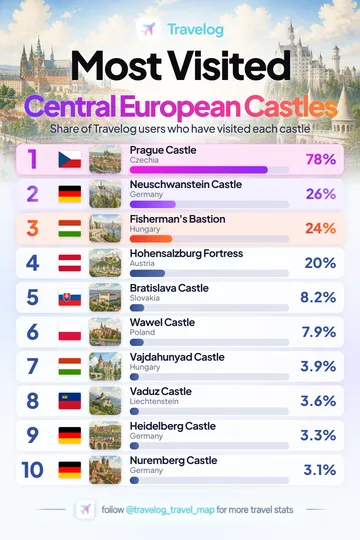
Prague Castle leads this Travelog castles & fortresses collection at 78%, followed by Neuschwanstein Castle at 26%.
View image and data →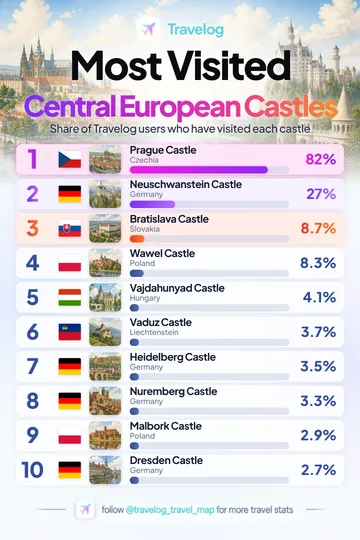
Prague Castle leads this Travelog castles collection at 82%, followed by Neuschwanstein Castle at 27%.
View image and data →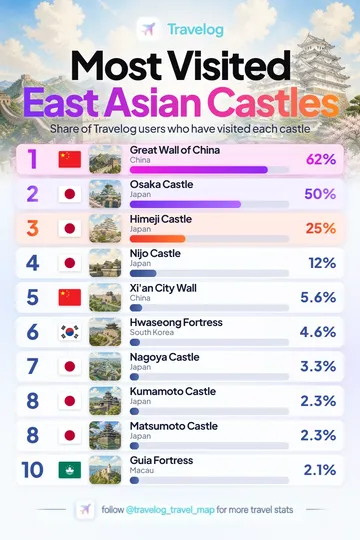
Great Wall of China leads this Travelog castles & fortresses collection at 62%, followed by Osaka Castle at 50%.
View image and data →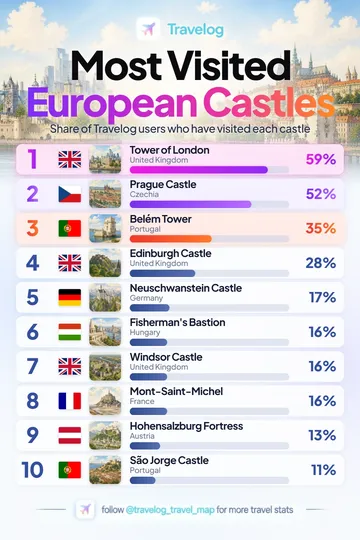
Tower of London leads this Travelog castles & fortresses collection at 59%, followed by Prague Castle at 52%.
View image and data →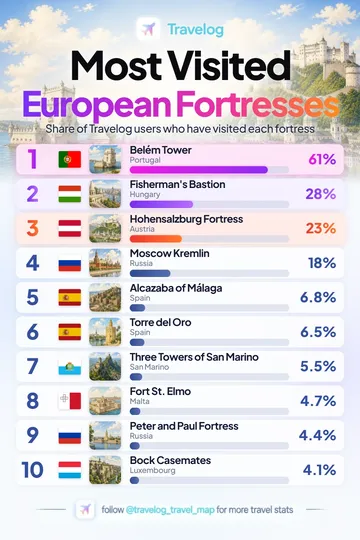
Belém Tower leads this Travelog fortresses, walls & defensive towers collection at 61%, followed by Fisherman's Bastion at 28%.
View image and data →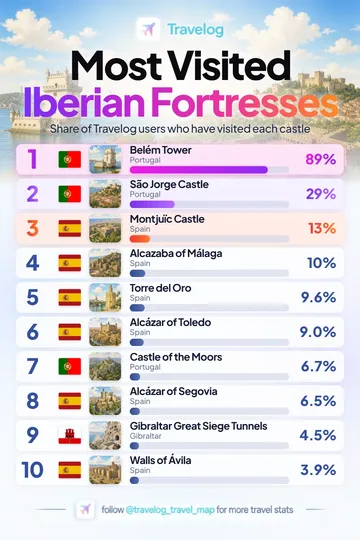
Belém Tower leads this Travelog castles & fortresses collection at 89%, followed by São Jorge Castle at 29%.
View image and data →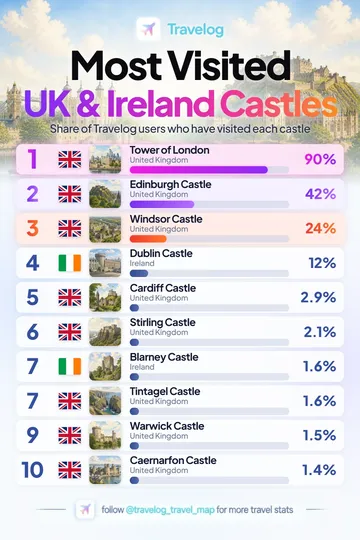
Tower of London leads this Travelog castles & fortresses collection at 90%, followed by Edinburgh Castle at 42%.
View image and data →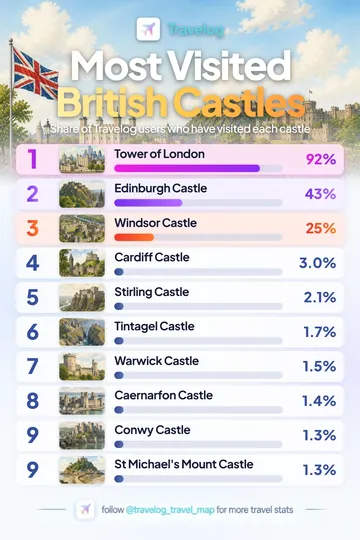
Tower of London leads this Travelog castles & fortresses collection at 92%, followed by Edinburgh Castle at 43%.
View image and data →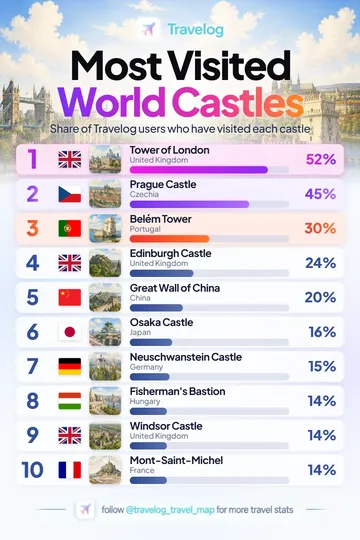
Tower of London leads this Travelog castles & fortresses collection at 52%, followed by Prague Castle at 45%.
View image and data →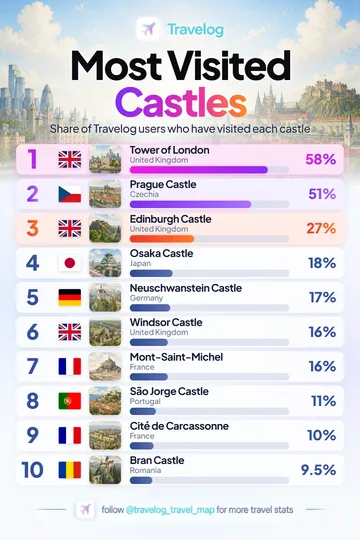
Tower of London leads this Travelog castles collection at 58%, followed by Prague Castle at 51%.
View image and data →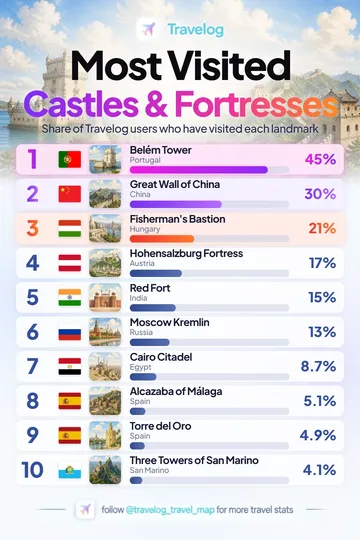
Belém Tower leads this Travelog fortresses, walls & defensive towers collection at 45%, followed by Great Wall of China at 30%.
View image and data →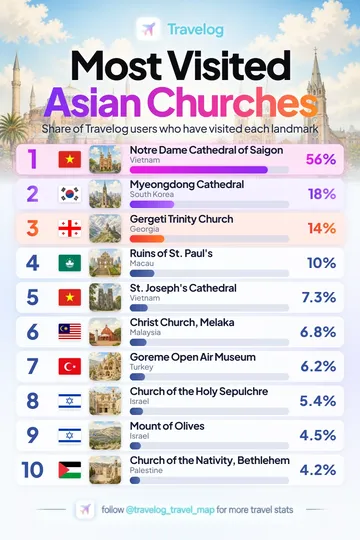
Notre Dame Cathedral of Saigon leads this Travelog churches & cathedrals collection at 56%, followed by Myeongdong Cathedral at 18%.
View image and data →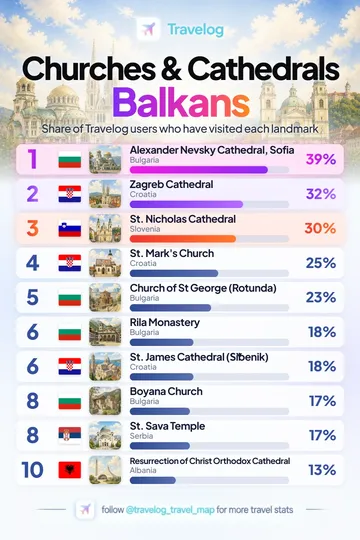
Alexander Nevsky Cathedral, Sofia leads this Travelog churches & cathedrals collection at 39%, followed by Zagreb Cathedral at 32%.
View image and data →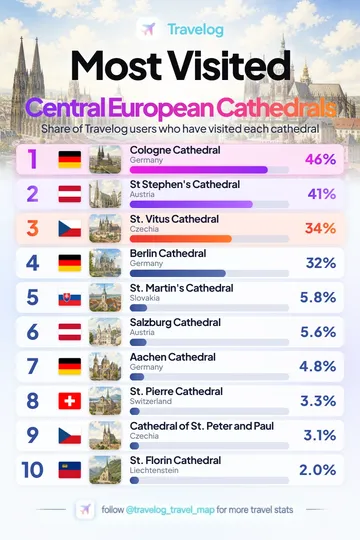
Cologne Cathedral leads this Travelog cathedrals collection at 46%, followed by St Stephen's Cathedral at 41%.
View image and data →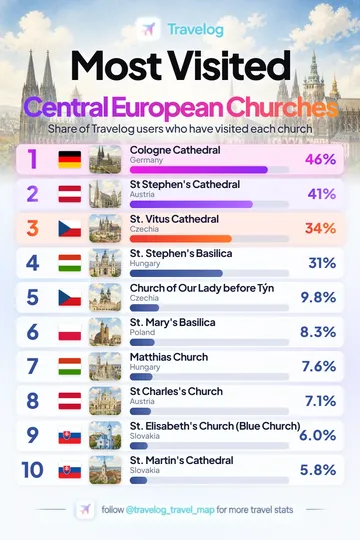
Cologne Cathedral leads this Travelog catholic churches collection at 46%, followed by St Stephen's Cathedral at 41%.
View image and data →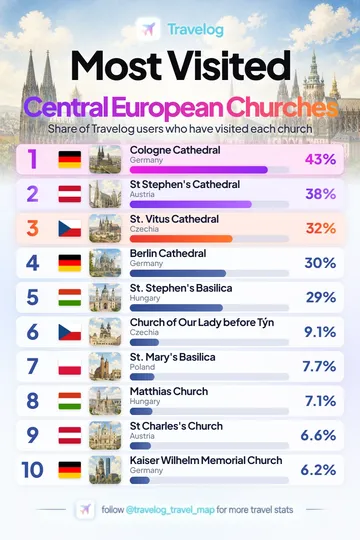
Cologne Cathedral leads this Travelog churches & cathedrals collection at 43%, followed by St Stephen's Cathedral at 38%.
View image and data →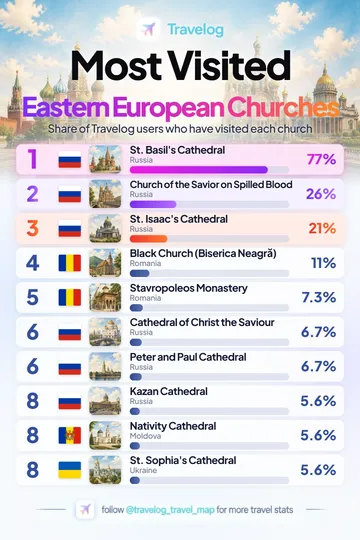
St. Basil's Cathedral leads this Travelog churches & cathedrals collection at 77%, followed by Church of the Savior on Spilled Blood at 26%.
View image and data →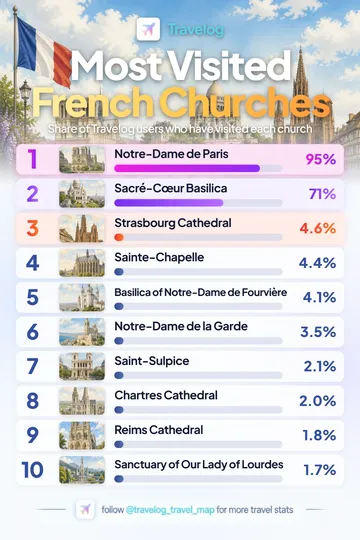
Notre-Dame de Paris leads this Travelog churches & cathedrals collection at 95%, followed by Sacré-Cœur Basilica at 71%.
View image and data →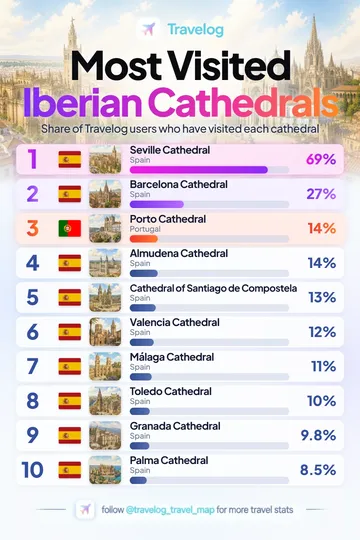
Seville Cathedral leads this Travelog cathedrals collection at 69%, followed by Barcelona Cathedral at 27%.
View image and data →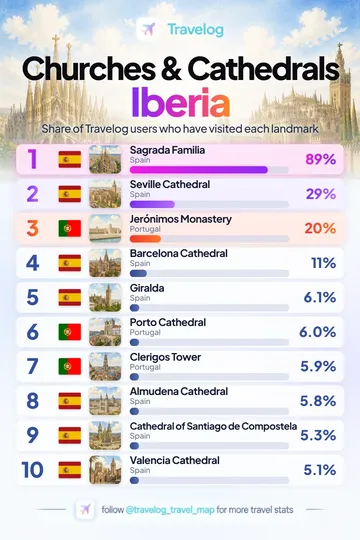
Sagrada Familia leads this Travelog churches & cathedrals collection at 89%, followed by Seville Cathedral at 29%.
View image and data →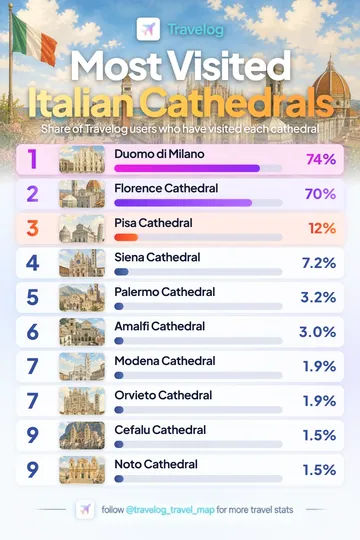
Duomo di Milano leads this Travelog cathedrals collection at 74%, followed by Florence Cathedral at 70%.
View image and data →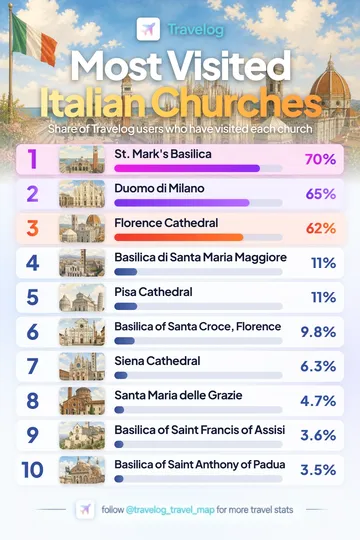
St. Mark's Basilica leads this Travelog churches & cathedrals collection at 70%, followed by Duomo di Milano at 65%.
View image and data →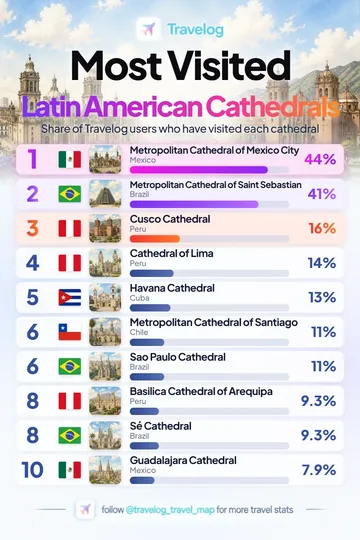
Metropolitan Cathedral of Mexico City leads this Travelog cathedrals collection at 44%, followed by Metropolitan Cathedral of Saint Sebastian at 41%.
View image and data →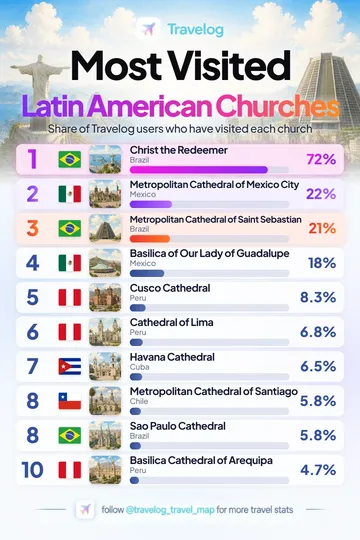
Christ the Redeemer leads this Travelog churches & cathedrals collection at 72%, followed by Metropolitan Cathedral of Mexico City at 22%.
View image and data →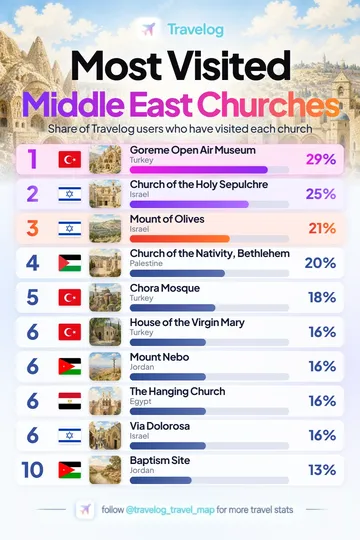
Goreme Open Air Museum leads this Travelog churches & cathedrals collection at 29%, followed by Church of the Holy Sepulchre at 25%.
View image and data →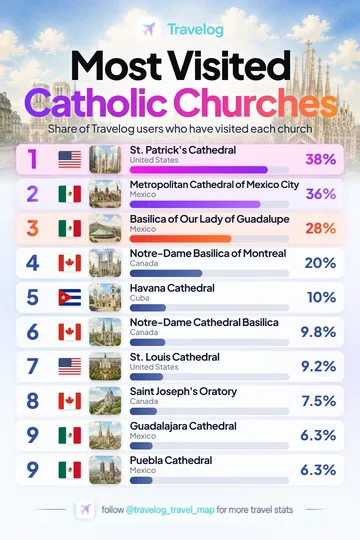
St. Patrick's Cathedral leads this Travelog catholic churches collection at 38%, followed by Metropolitan Cathedral of Mexico City at 36%.
View image and data →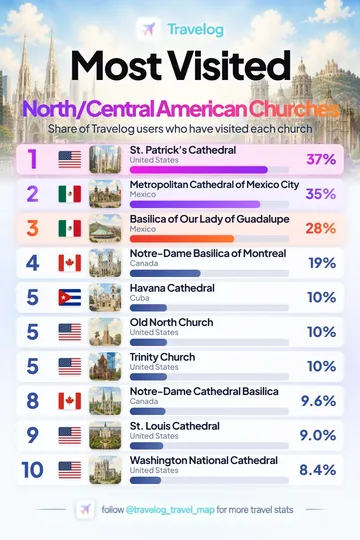
St. Patrick's Cathedral leads this Travelog churches & cathedrals collection at 37%, followed by Metropolitan Cathedral of Mexico City at 35%.
View image and data →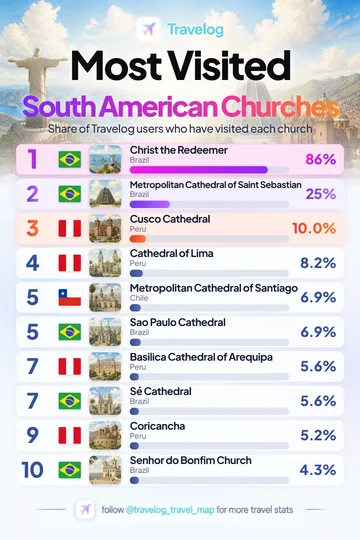
Christ the Redeemer leads this Travelog churches & cathedrals collection at 86%, followed by Metropolitan Cathedral of Saint Sebastian at 25%.
View image and data →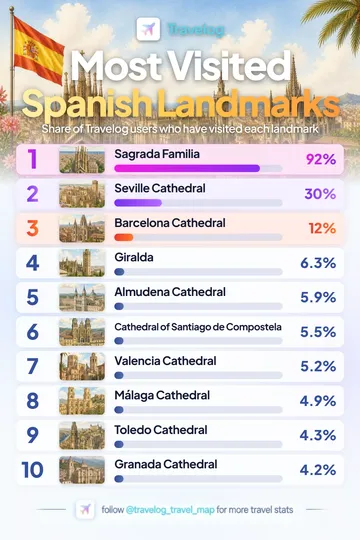
Sagrada Familia leads this Travelog churches & cathedrals collection at 92%, followed by Seville Cathedral at 30%.
View image and data →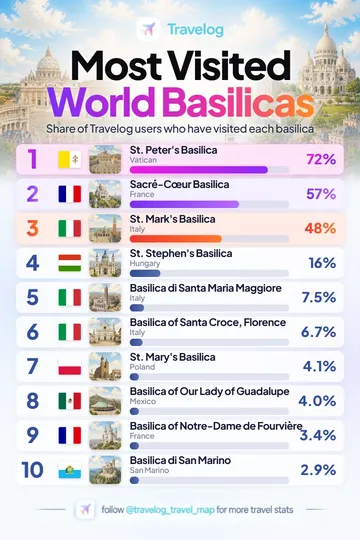
St. Peter's Basilica leads this Travelog basilicas collection at 72%, followed by Sacré-Cœur Basilica at 57%.
View image and data →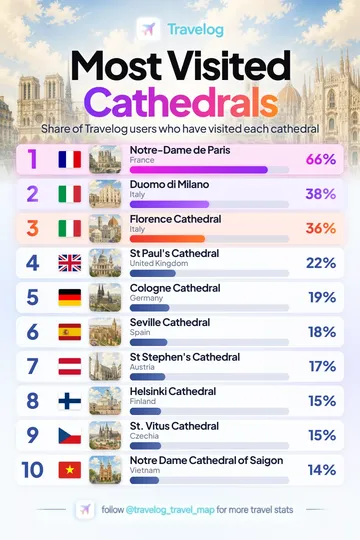
Notre-Dame de Paris leads this Travelog cathedrals collection at 66%, followed by Duomo di Milano at 38%.
View image and data →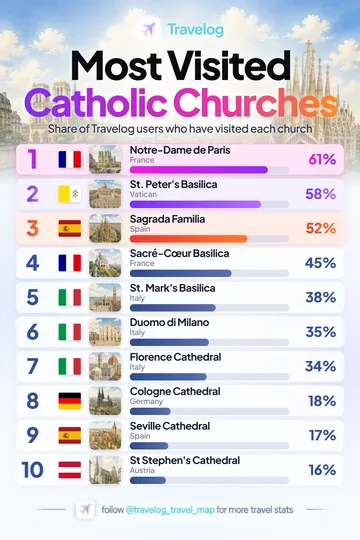
Notre-Dame de Paris leads this Travelog catholic churches collection at 61%, followed by St. Peter's Basilica at 58%.
View image and data →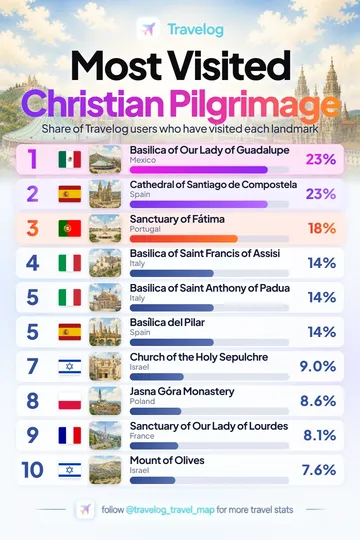
Basilica of Our Lady of Guadalupe leads this Travelog christian pilgrimage sites outside vatican city collection at 23%, followed by Cathedral of Santiago de Compostela at 23%.
View image and data →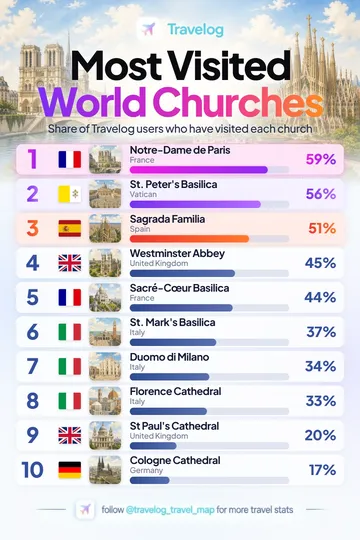
Notre-Dame de Paris leads this Travelog churches & cathedrals collection at 59%, followed by St. Peter's Basilica at 56%.
View image and data →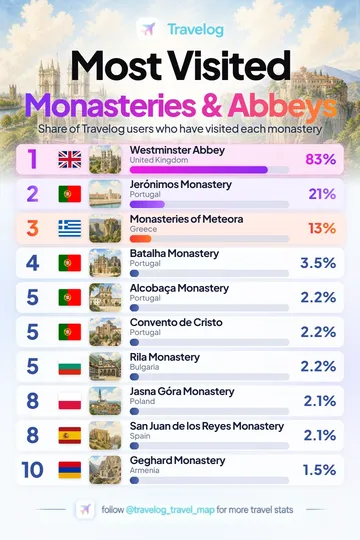
Westminster Abbey leads this Travelog monasteries & abbeys collection at 83%, followed by Jerónimos Monastery at 21%.
View image and data →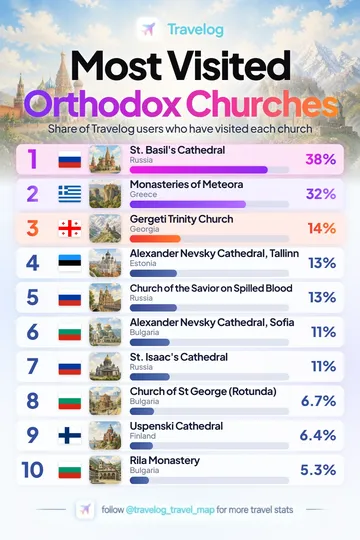
St. Basil's Cathedral leads this Travelog orthodox churches & monasteries collection at 38%, followed by Monasteries of Meteora at 32%.
View image and data →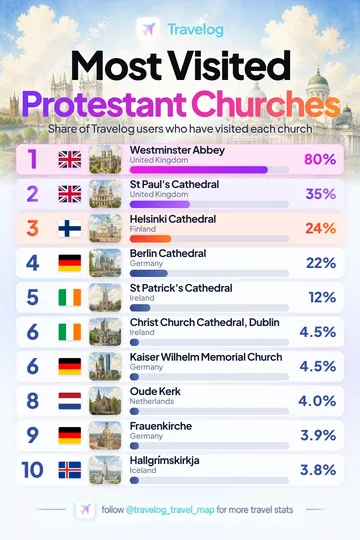
Westminster Abbey leads this Travelog protestant & anglican churches collection at 80%, followed by St Paul's Cathedral at 35%.
View image and data →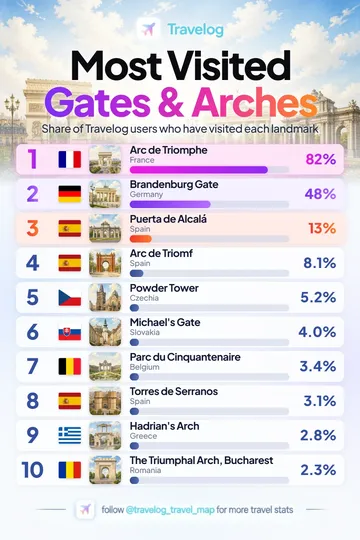
Arc de Triomphe leads this Travelog gates & arches collection at 82%, followed by Brandenburg Gate at 48%.
View image and data →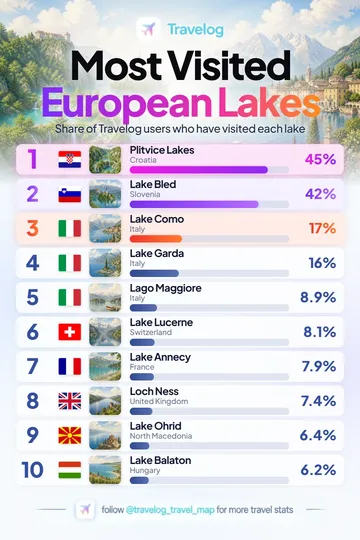
Plitvice Lakes leads this Travelog lakes collection at 45%, followed by Lake Bled at 42%.
View image and data →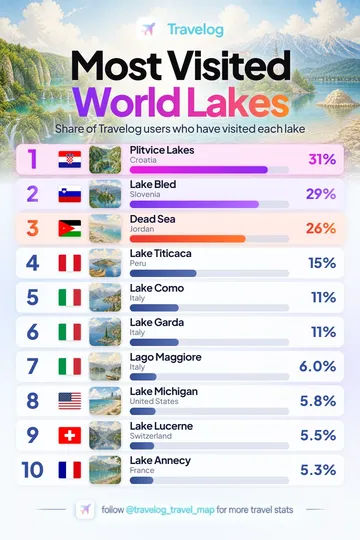
Plitvice Lakes leads this Travelog lakes collection at 31%, followed by Lake Bled at 29%.
View image and data →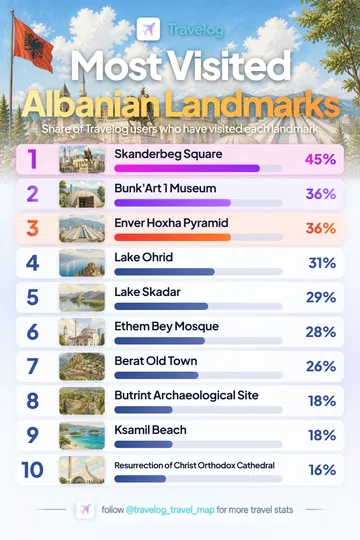
Skanderbeg Square ranks first at 45% in this Travelog Albania landmark graphic, followed by Bunk'Art 1 Museum at 36%.
View image and data →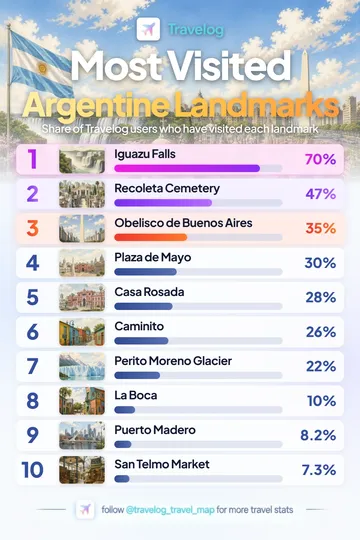
Iguazu Falls ranks first at 70% in this Travelog Argentina landmark graphic, followed by Recoleta Cemetery at 47%.
View image and data →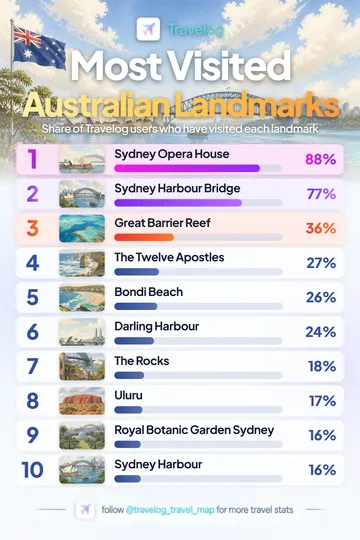
Sydney Opera House ranks first at 88% in this Travelog Australia landmark graphic, followed by Sydney Harbour Bridge at 77%.
View image and data →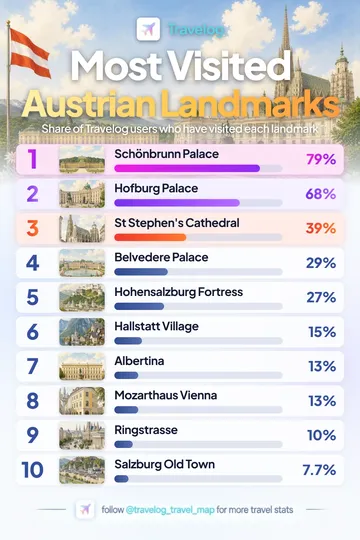
Schönbrunn Palace ranks first at 79% in this Travelog Austria landmark graphic, followed by Hofburg Palace at 68%.
View image and data →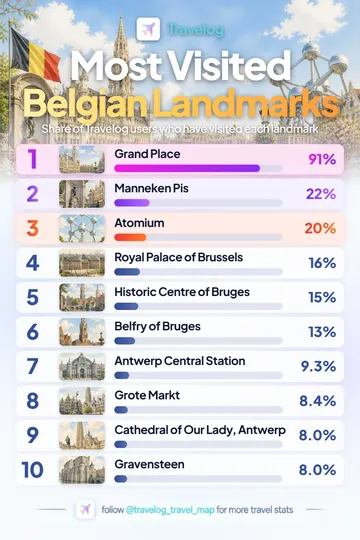
Grand Place ranks first at 91% in this Travelog Belgium landmark graphic, followed by Manneken Pis at 22%.
View image and data →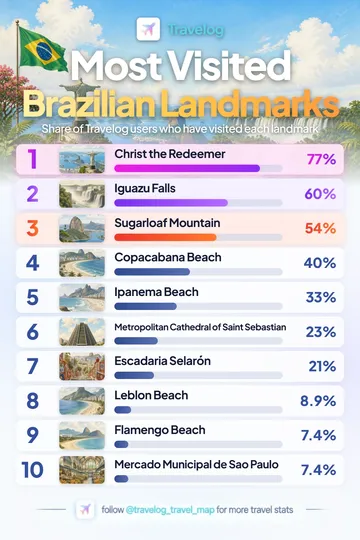
Christ the Redeemer ranks first at 77% in this Travelog Brazil landmark graphic, followed by Iguazu Falls at 60%.
View image and data →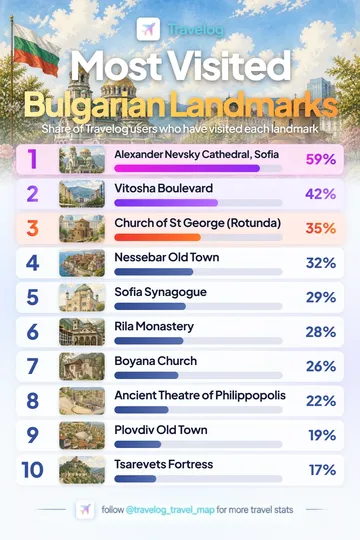
Alexander Nevsky Cathedral, Sofia ranks first at 59% in this Travelog Bulgaria landmark graphic, followed by Vitosha Boulevard at 42%.
View image and data →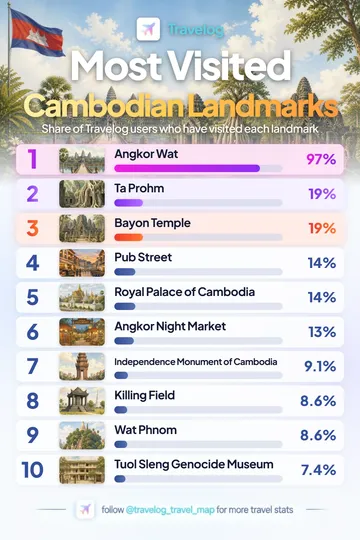
Angkor Wat ranks first at 97% in this Travelog Cambodia landmark graphic, followed by Ta Prohm at 19%.
View image and data →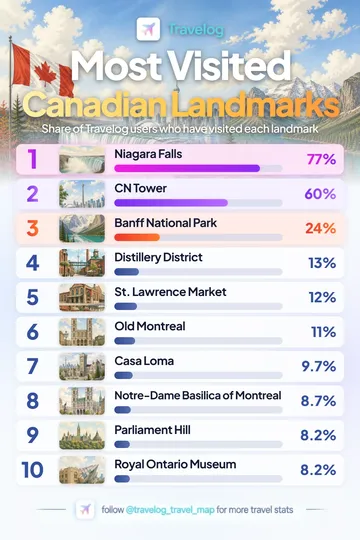
Niagara Falls ranks first at 77% in this Travelog Canada landmark graphic, followed by CN Tower at 60%.
View image and data →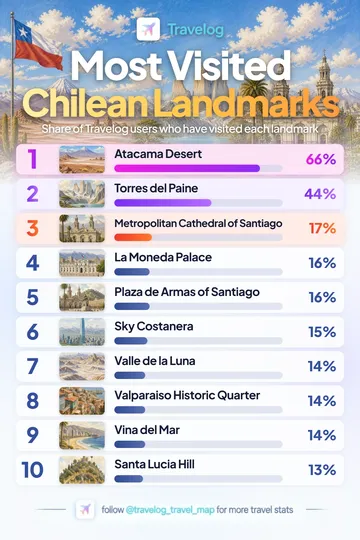
Atacama Desert ranks first at 66% in this Travelog Chile landmark graphic, followed by Torres del Paine at 44%.
View image and data →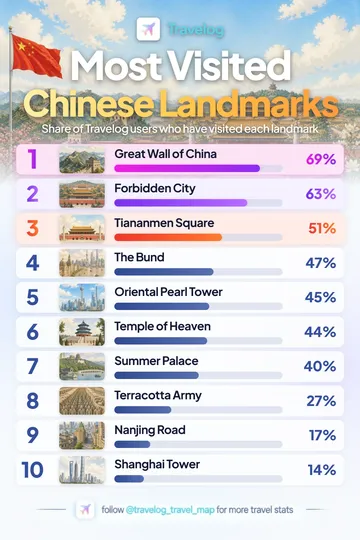
Great Wall of China ranks first at 69% in this Travelog China landmark graphic, followed by Forbidden City at 63%.
View image and data →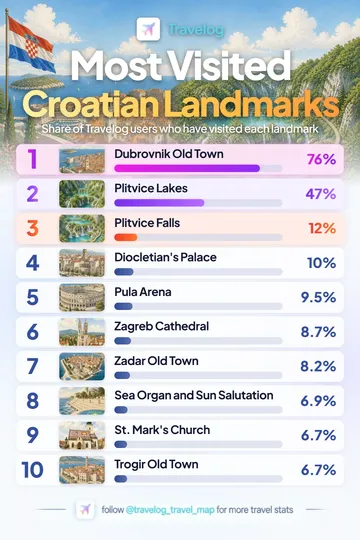
Dubrovnik Old Town ranks first at 76% in this Travelog Croatia landmark graphic, followed by Plitvice Lakes at 47%.
View image and data →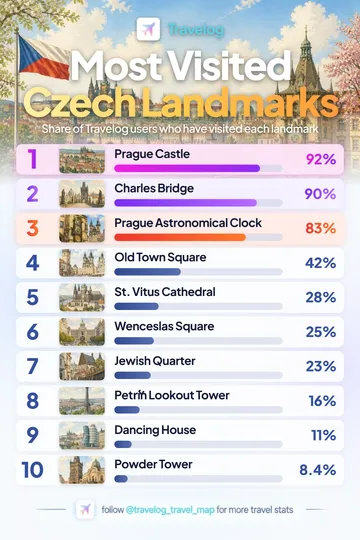
Prague Castle ranks first at 92% in this Travelog Czechia landmark graphic, followed by Charles Bridge at 90%.
View image and data →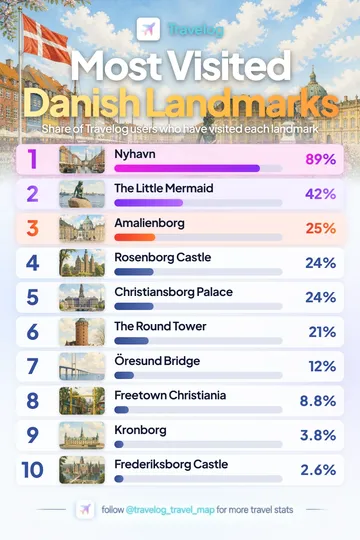
Nyhavn ranks first at 89% in this Travelog Denmark landmark graphic, followed by The Little Mermaid at 42%.
View image and data →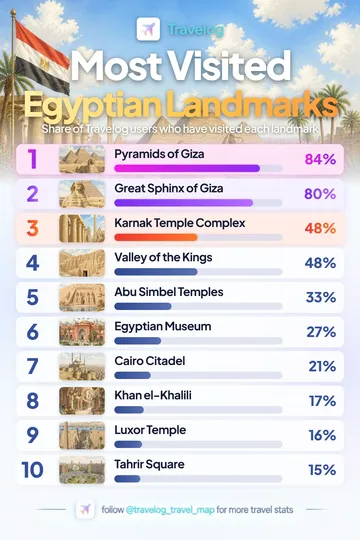
Pyramids of Giza ranks first at 84% in this Travelog Egypt landmark graphic, followed by Great Sphinx of Giza at 80%.
View image and data →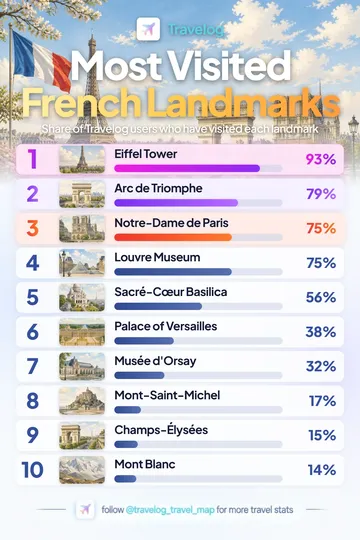
Eiffel Tower ranks first at 93% in this Travelog France landmark graphic, followed by Arc de Triomphe at 79%.
View image and data →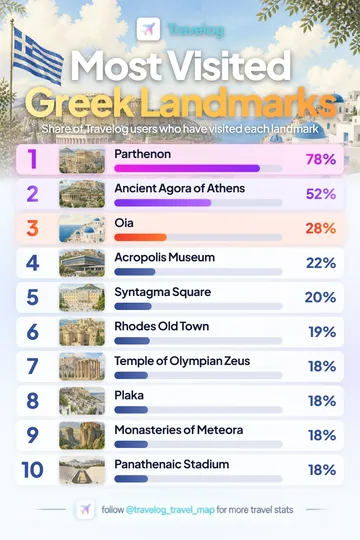
Parthenon ranks first at 78% in this Travelog Greece landmark graphic, followed by Ancient Agora of Athens at 52%.
View image and data →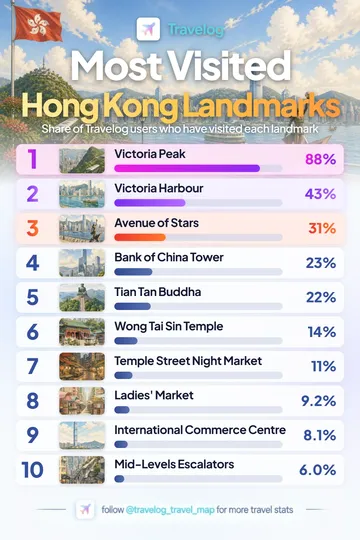
Victoria Peak ranks first at 88% in this Travelog Hong Kong landmark graphic, followed by Victoria Harbour at 43%.
View image and data →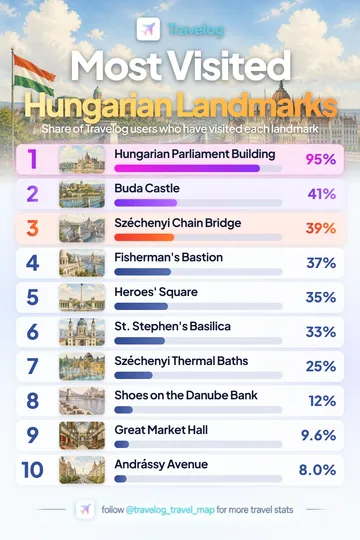
Hungarian Parliament Building ranks first at 95% in this Travelog Hungary landmark graphic, followed by Buda Castle at 41%.
View image and data →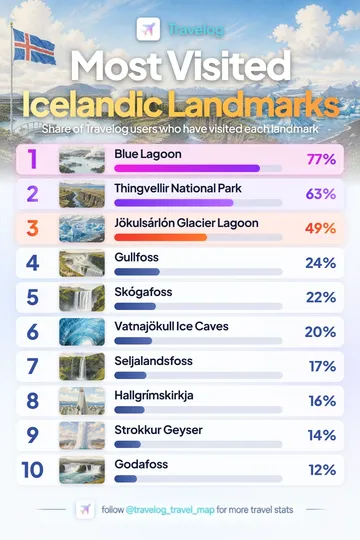
Blue Lagoon ranks first at 77% in this Travelog Iceland landmark graphic, followed by Thingvellir National Park at 63%.
View image and data →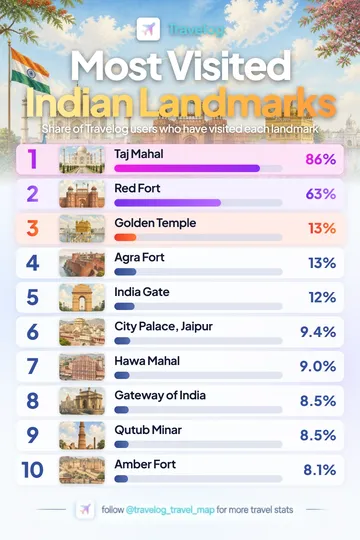
Taj Mahal ranks first at 86% in this Travelog India landmark graphic, followed by Red Fort at 63%.
View image and data →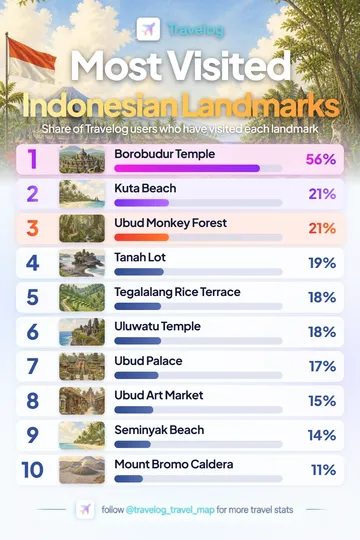
Borobudur Temple ranks first at 56% in this Travelog Indonesia landmark graphic, followed by Kuta Beach at 21%.
View image and data →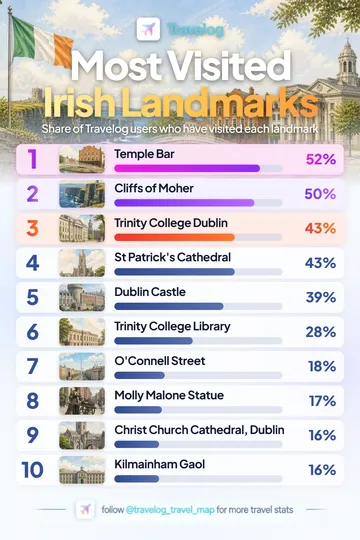
Temple Bar ranks first at 52% in this Travelog Ireland landmark graphic, followed by Cliffs of Moher at 50%.
View image and data →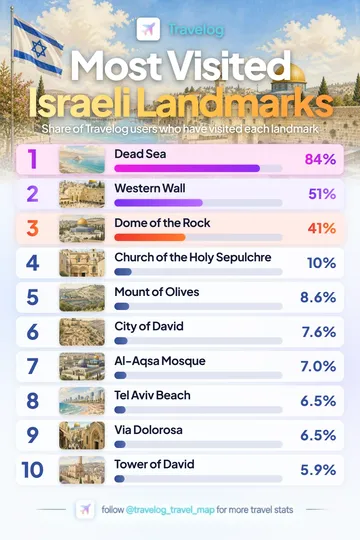
Dead Sea ranks first at 84% in this Travelog Israel landmark graphic, followed by Western Wall at 51%.
View image and data →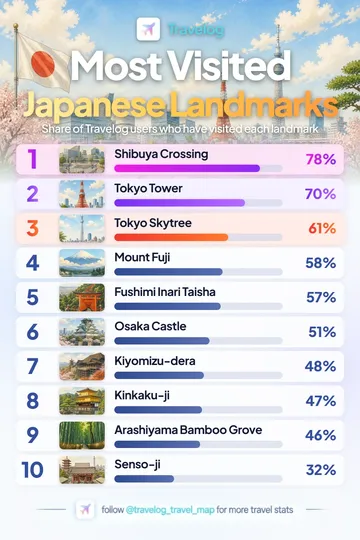
Shibuya Crossing ranks first at 78% in this Travelog Japan landmark graphic, followed by Tokyo Tower at 70%.
View image and data →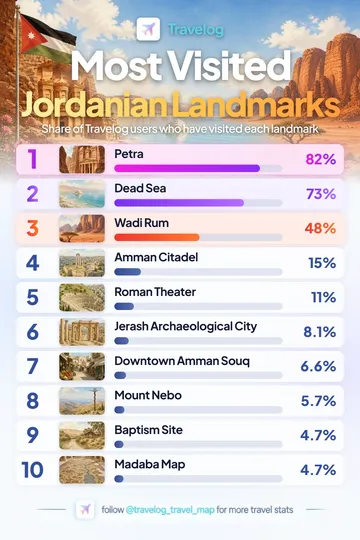
Petra ranks first at 82% in this Travelog Jordan landmark graphic, followed by Dead Sea at 73%.
View image and data →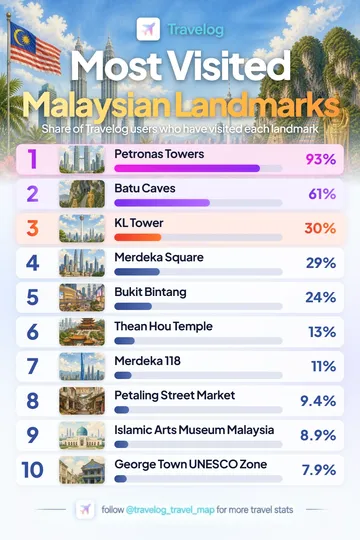
Petronas Towers ranks first at 93% in this Travelog Malaysia landmark graphic, followed by Batu Caves at 61%.
View image and data →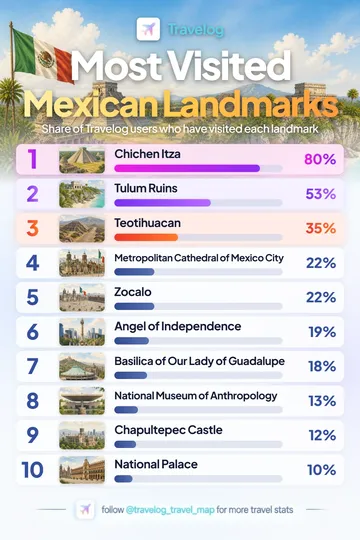
Chichen Itza ranks first at 80% in this Travelog Mexico landmark graphic, followed by Tulum Ruins at 53%.
View image and data →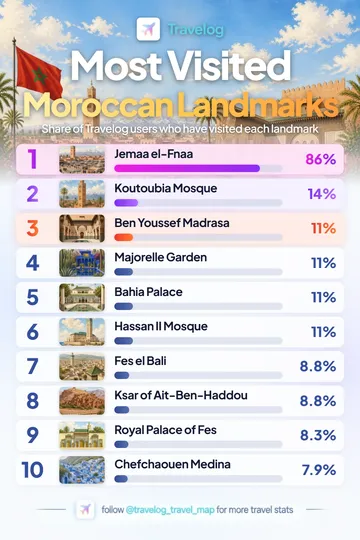
Jemaa el-Fnaa ranks first at 86% in this Travelog Morocco landmark graphic, followed by Koutoubia Mosque at 14%.
View image and data →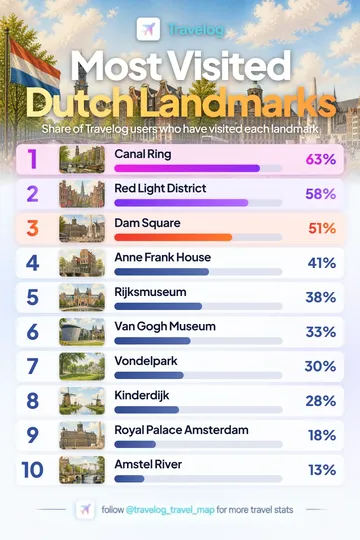
Canal Ring ranks first at 63% in this Travelog Netherlands landmark graphic, followed by Red Light District at 58%.
View image and data →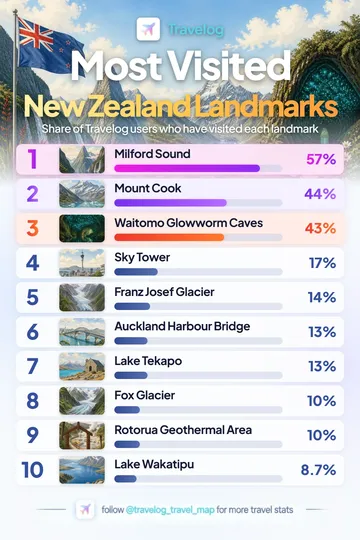
Milford Sound ranks first at 57% in this Travelog New Zealand landmark graphic, followed by Mount Cook at 44%.
View image and data →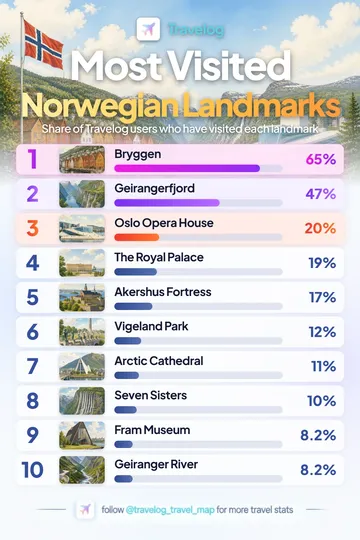
Bryggen ranks first at 65% in this Travelog Norway landmark graphic, followed by Geirangerfjord at 47%.
View image and data →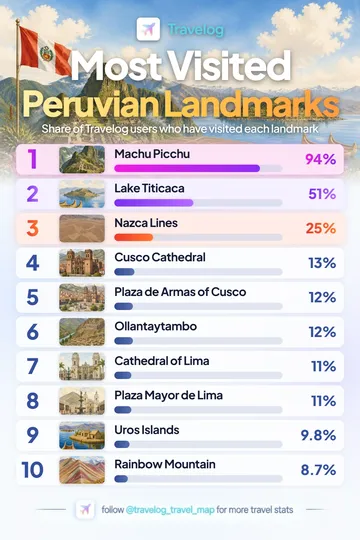
Machu Picchu ranks first at 94% in this Travelog Peru landmark graphic, followed by Lake Titicaca at 51%.
View image and data →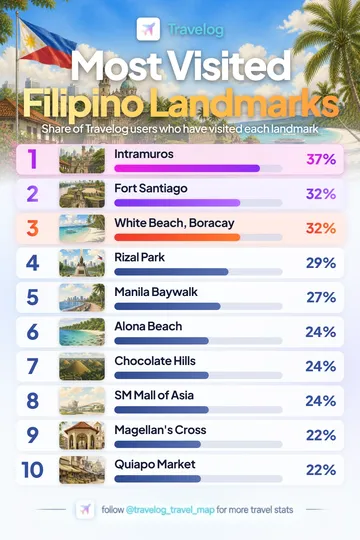
Intramuros ranks first at 37% in this Travelog Philippines landmark graphic, followed by Fort Santiago at 32%.
View image and data →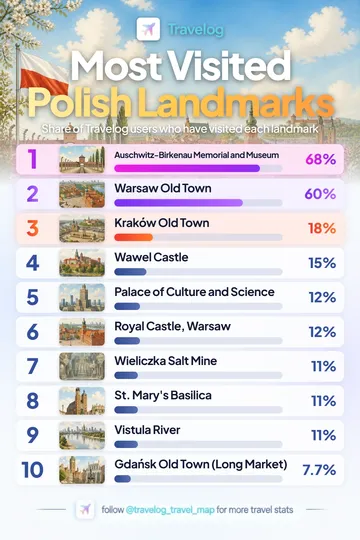
Auschwitz-Birkenau Memorial and Museum ranks first at 68% in this Travelog Poland landmark graphic, followed by Warsaw Old Town at 60%.
View image and data →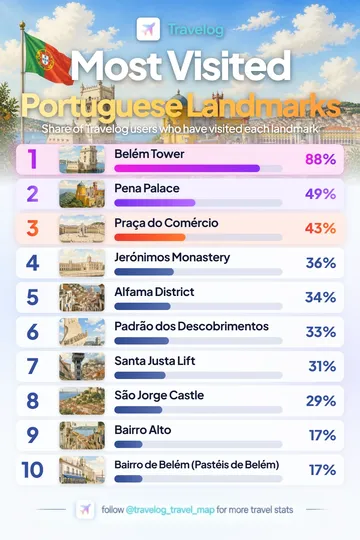
Belém Tower ranks first at 88% in this Travelog Portugal landmark graphic, followed by Pena Palace at 49%.
View image and data →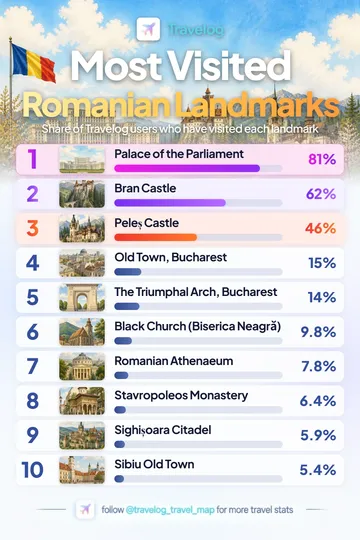
Palace of the Parliament ranks first at 81% in this Travelog Romania landmark graphic, followed by Bran Castle at 62%.
View image and data →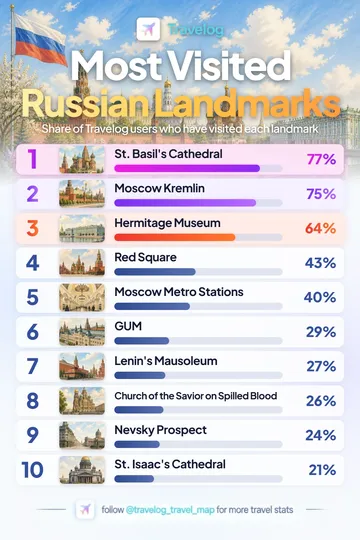
St. Basil's Cathedral ranks first at 77% in this Travelog Russia landmark graphic, followed by Moscow Kremlin at 75%.
View image and data →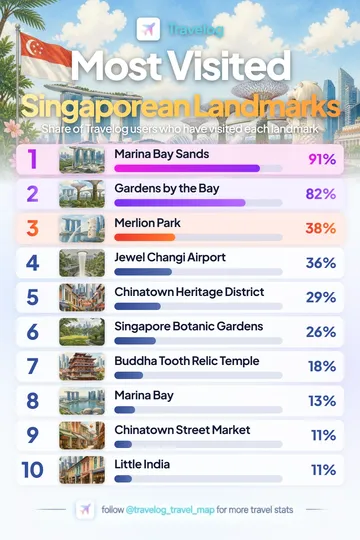
Marina Bay Sands ranks first at 91% in this Travelog Singapore landmark graphic, followed by Gardens by the Bay at 82%.
View image and data →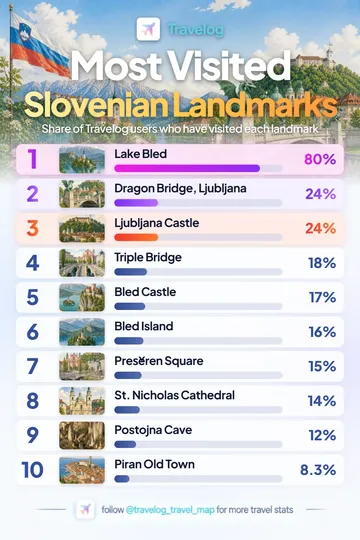
Lake Bled ranks first at 80% in this Travelog Slovenia landmark graphic, followed by Dragon Bridge, Ljubljana at 24%.
View image and data →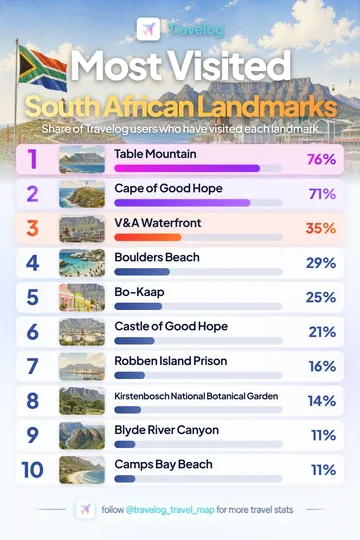
Table Mountain ranks first at 76% in this Travelog South Africa landmark graphic, followed by Cape of Good Hope at 71%.
View image and data →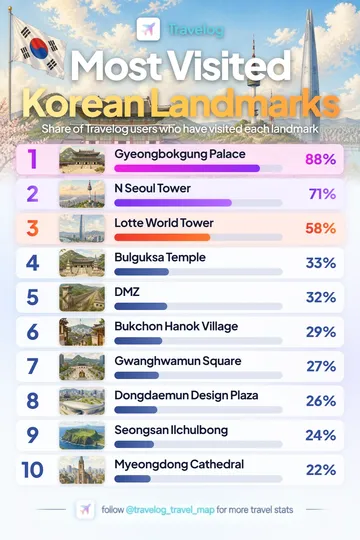
Gyeongbokgung Palace ranks first at 88% in this Travelog South Korea landmark graphic, followed by N Seoul Tower at 71%.
View image and data →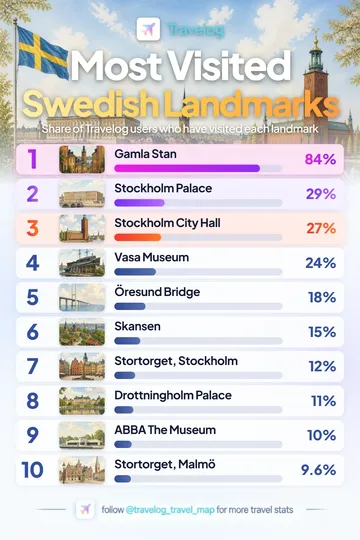
Gamla Stan ranks first at 84% in this Travelog Sweden landmark graphic, followed by Stockholm Palace at 29%.
View image and data →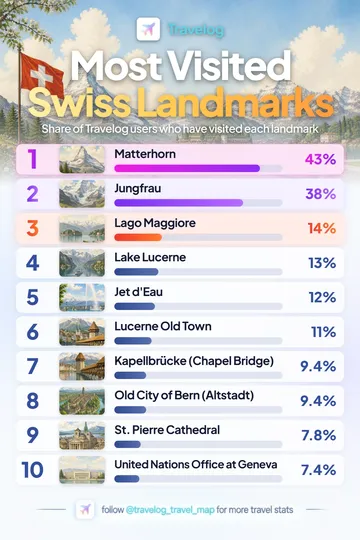
Matterhorn ranks first at 43% in this Travelog Switzerland landmark graphic, followed by Jungfrau at 38%.
View image and data →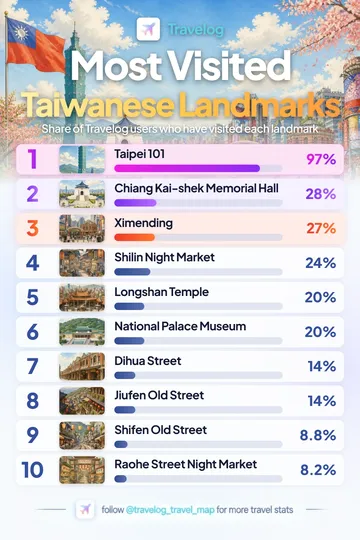
Taipei 101 ranks first at 97% in this Travelog Taiwan landmark graphic, followed by Chiang Kai-shek Memorial Hall at 28%.
View image and data →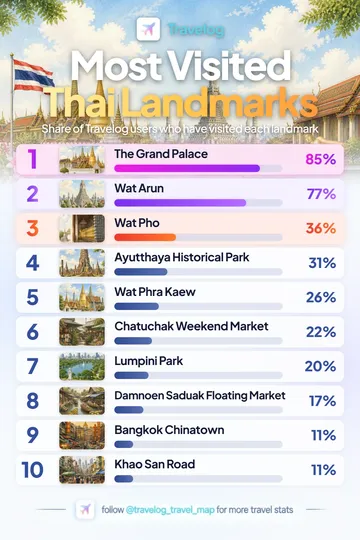
The Grand Palace ranks first at 85% in this Travelog Thailand landmark graphic, followed by Wat Arun at 77%.
View image and data →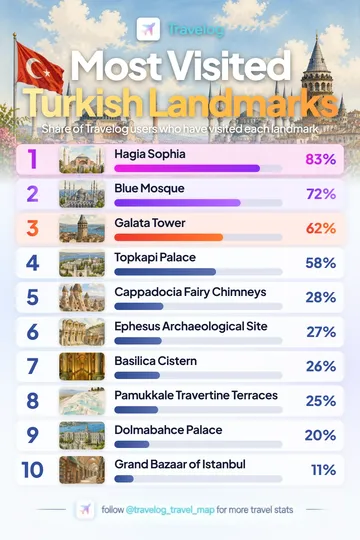
Hagia Sophia ranks first at 83% in this Travelog Turkey landmark graphic, followed by Blue Mosque at 72%.
View image and data →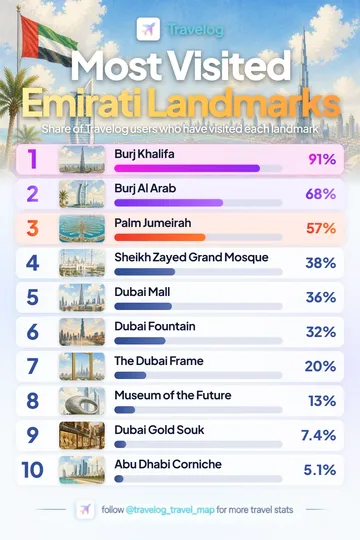
Burj Khalifa ranks first at 91% in this Travelog United Arab Emirates landmark graphic, followed by Burj Al Arab at 68%.
View image and data →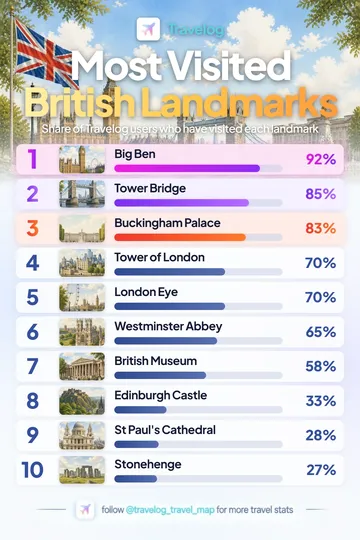
Big Ben ranks first at 92% in this Travelog United Kingdom landmark graphic, followed by Tower Bridge at 85%.
View image and data →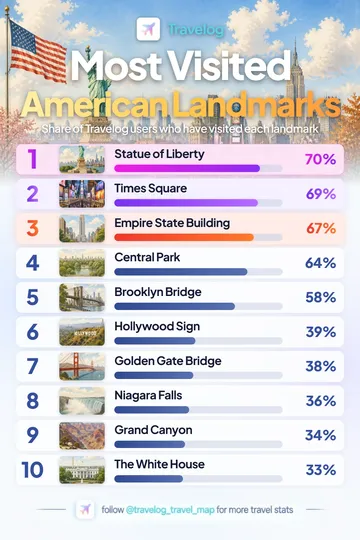
Statue of Liberty ranks first at 70% in this Travelog United States landmark graphic, followed by Times Square at 69%.
View image and data →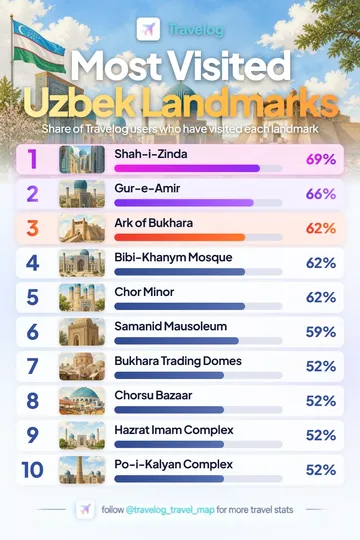
Shah-i-Zinda ranks first at 69% in this Travelog Uzbekistan landmark graphic, followed by Gur-e-Amir at 66%.
View image and data →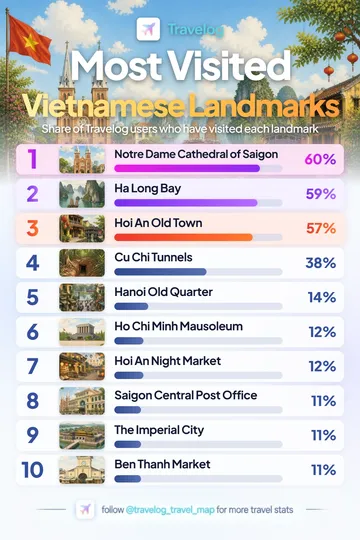
Notre Dame Cathedral of Saigon ranks first at 60% in this Travelog Vietnam landmark graphic, followed by Ha Long Bay at 59%.
View image and data →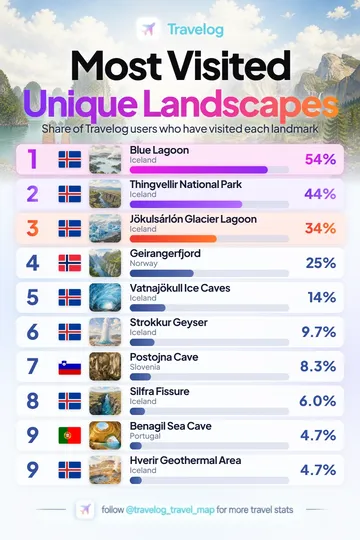
Blue Lagoon leads this Travelog caves, glaciers, geothermal sites & deserts collection at 54%, followed by Thingvellir National Park at 44%.
View image and data →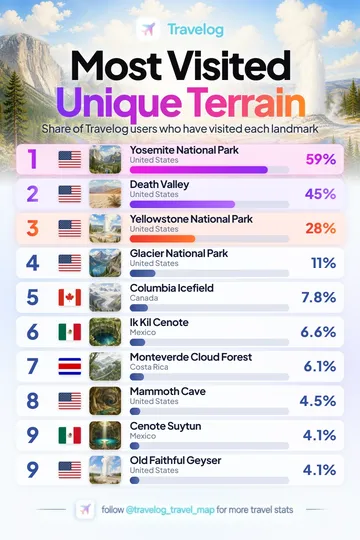
Yosemite National Park leads this Travelog caves, glaciers, geothermal sites & deserts collection at 59%, followed by Death Valley at 45%.
View image and data →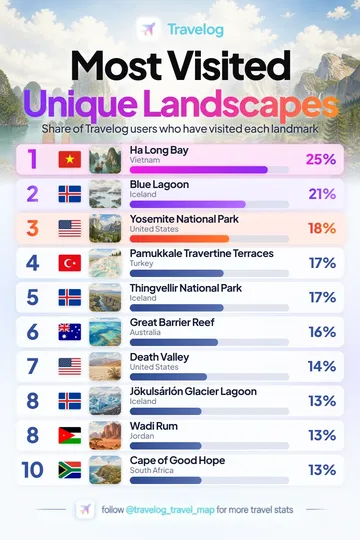
Ha Long Bay leads this Travelog caves, glaciers, geothermal sites & deserts collection at 25%, followed by Blue Lagoon at 21%.
View image and data →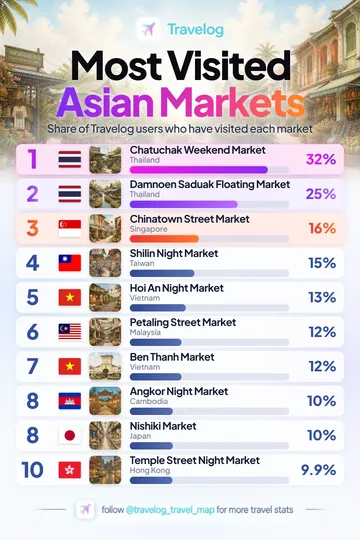
Chatuchak Weekend Market leads this Travelog markets collection at 32%, followed by Damnoen Saduak Floating Market at 25%.
View image and data →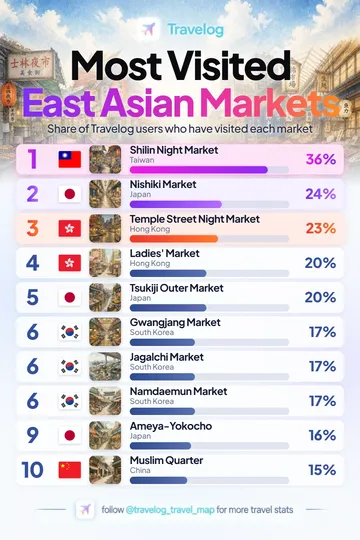
Shilin Night Market leads this Travelog markets collection at 36%, followed by Nishiki Market at 24%.
View image and data →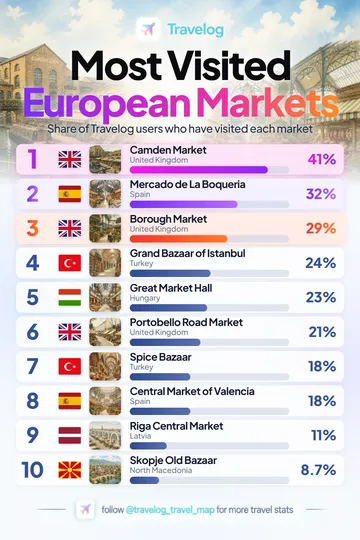
Camden Market leads this Travelog markets collection at 41%, followed by Mercado de La Boqueria at 32%.
View image and data →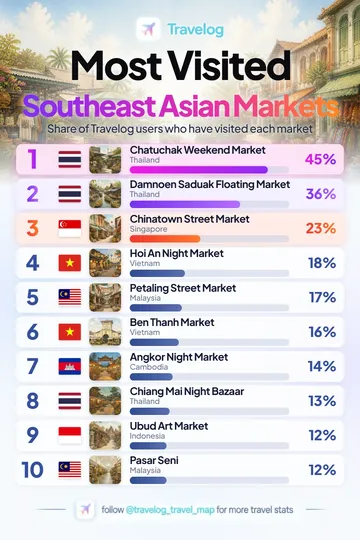
Chatuchak Weekend Market leads this Travelog markets collection at 45%, followed by Damnoen Saduak Floating Market at 36%.
View image and data →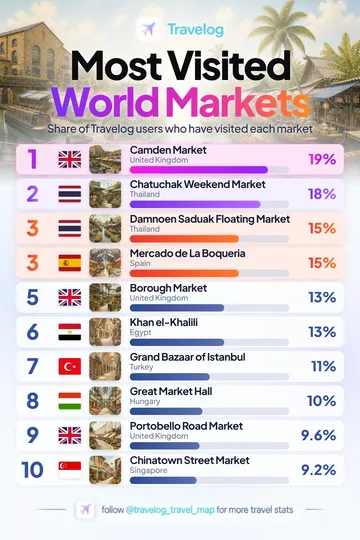
Camden Market leads this Travelog markets collection at 19%, followed by Chatuchak Weekend Market at 18%.
View image and data →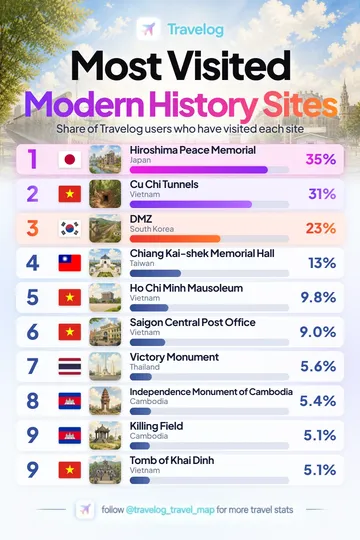
Hiroshima Peace Memorial leads this Travelog historic sites & memorials collection at 35%, followed by Cu Chi Tunnels at 31%.
View image and data →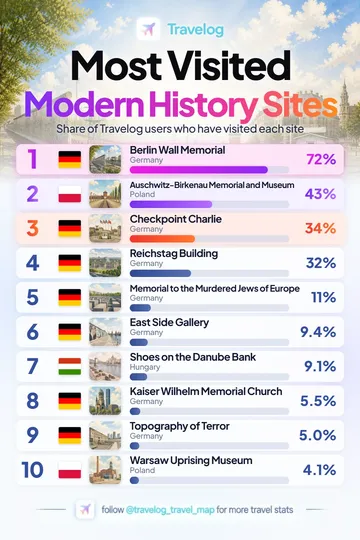
Berlin Wall Memorial leads this Travelog historic sites & memorials collection at 72%, followed by Auschwitz-Birkenau Memorial and Museum at 43%.
View image and data →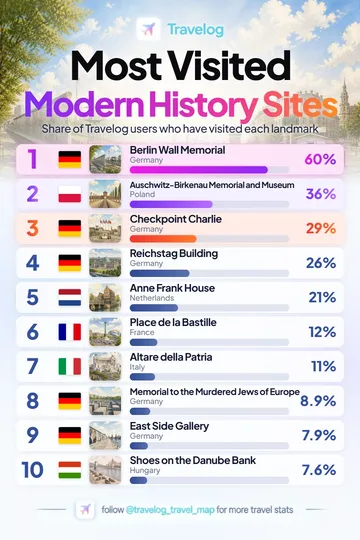
Berlin Wall Memorial leads this Travelog historic sites & memorials collection at 60%, followed by Auschwitz-Birkenau Memorial and Museum at 36%.
View image and data →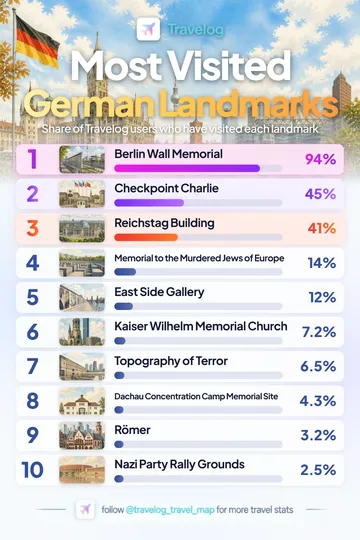
Berlin Wall Memorial leads this Travelog historic sites & memorials collection at 94%, followed by Checkpoint Charlie at 45%.
View image and data →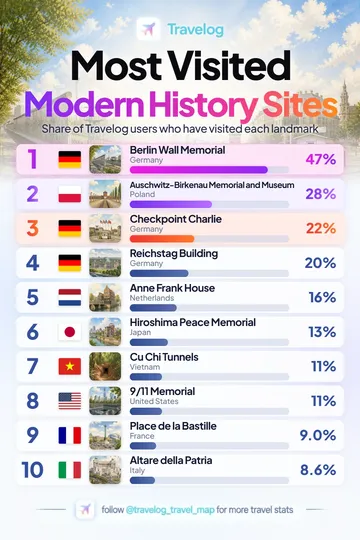
Berlin Wall Memorial leads this Travelog historic sites & memorials collection at 47%, followed by Auschwitz-Birkenau Memorial and Museum at 28%.
View image and data →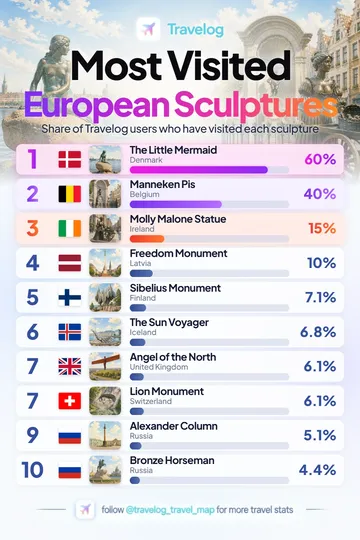
The Little Mermaid leads this Travelog statues & sculptures collection at 60%, followed by Manneken Pis at 40%.
View image and data →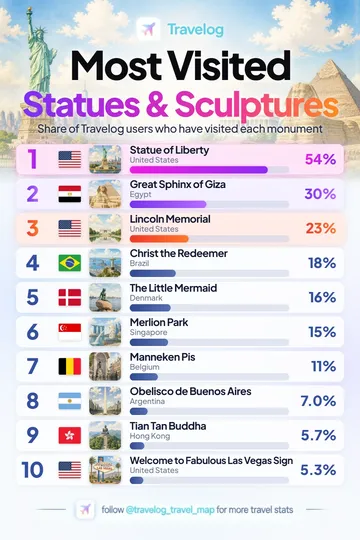
Statue of Liberty leads this Travelog statues & sculptures collection at 54%, followed by Great Sphinx of Giza at 30%.
View image and data →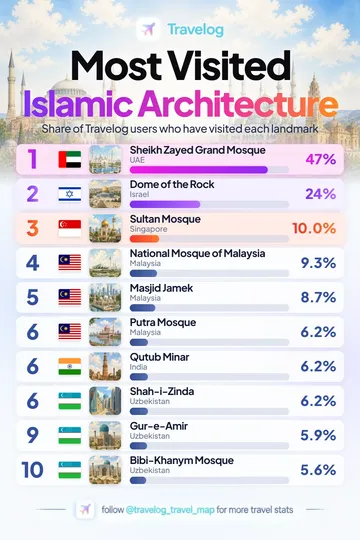
Sheikh Zayed Grand Mosque leads this Travelog mosques & islamic architecture collection at 47%, followed by Dome of the Rock at 24%.
View image and data →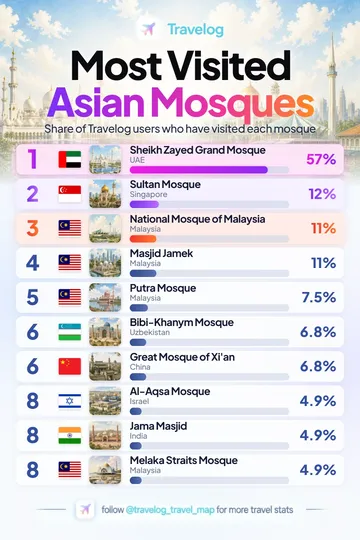
Sheikh Zayed Grand Mosque leads this Travelog mosques collection at 57%, followed by Sultan Mosque at 12%.
View image and data →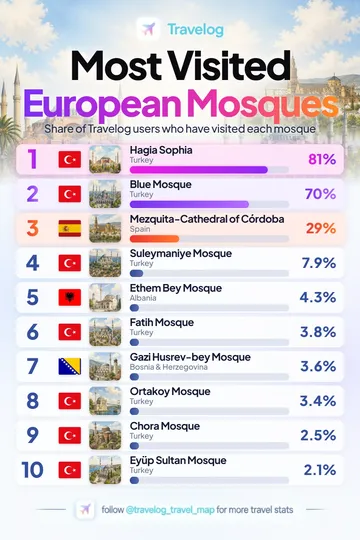
Hagia Sophia leads this Travelog mosques & islamic architecture collection at 81%, followed by Blue Mosque at 70%.
View image and data →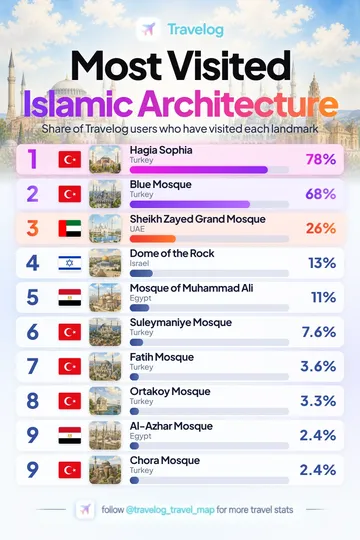
Hagia Sophia leads this Travelog mosques & islamic architecture collection at 78%, followed by Blue Mosque at 68%.
View image and data →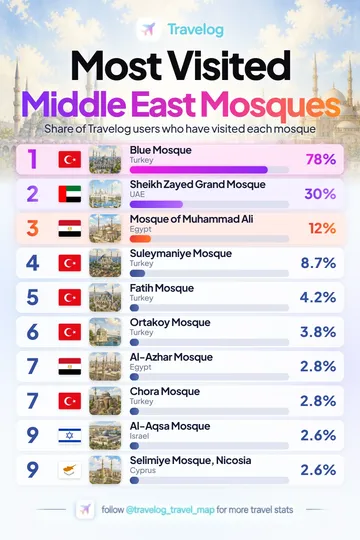
Blue Mosque leads this Travelog mosques collection at 78%, followed by Sheikh Zayed Grand Mosque at 30%.
View image and data →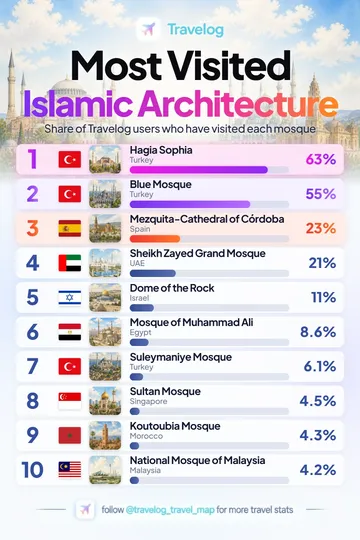
Hagia Sophia leads this Travelog mosques & islamic architecture collection at 63%, followed by Blue Mosque at 55%.
View image and data →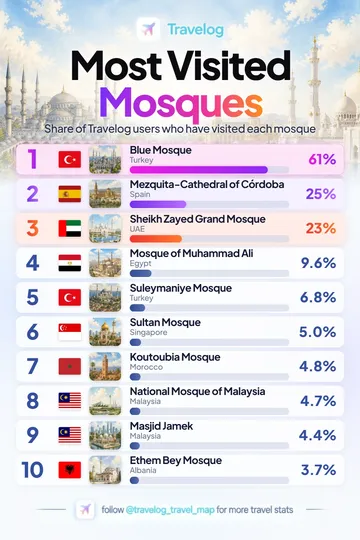
Blue Mosque leads this Travelog mosques collection at 61%, followed by Mezquita-Cathedral of Córdoba at 25%.
View image and data →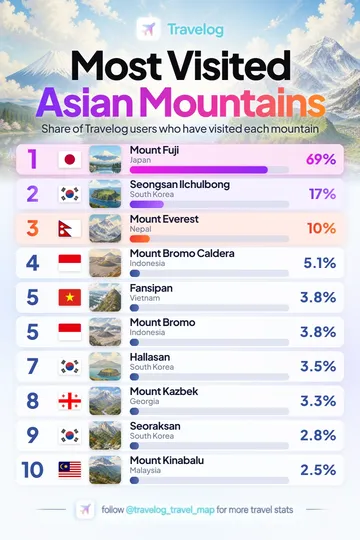
Mount Fuji leads this Travelog mountains & volcanoes collection at 69%, followed by Seongsan Ilchulbong at 17%.
View image and data →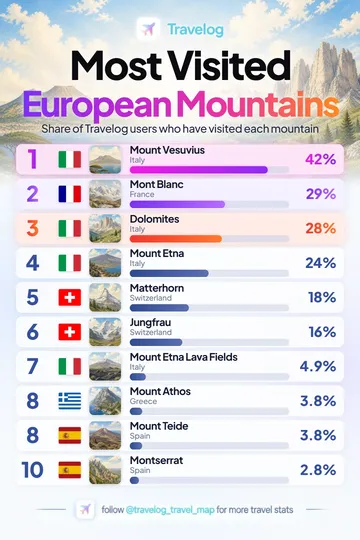
Mount Vesuvius leads this Travelog mountains & volcanoes collection at 42%, followed by Mont Blanc at 29%.
View image and data →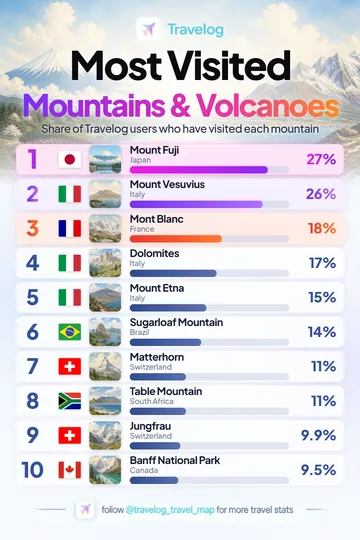
Mount Fuji leads this Travelog mountains & volcanoes collection at 27%, followed by Mount Vesuvius at 26%.
View image and data →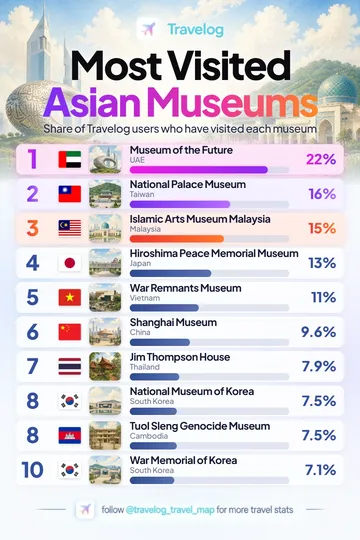
Museum of the Future leads this Travelog museums & galleries collection at 22%, followed by National Palace Museum at 16%.
View image and data →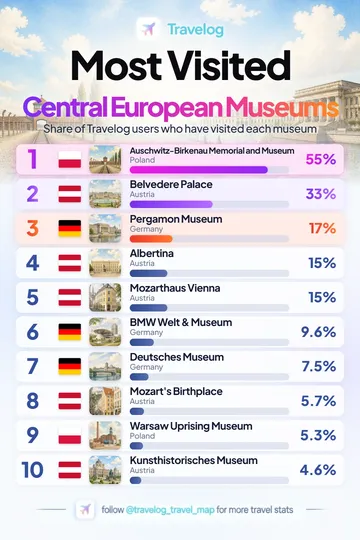
Auschwitz-Birkenau Memorial and Museum leads this Travelog museums & galleries collection at 55%, followed by Belvedere Palace at 33%.
View image and data →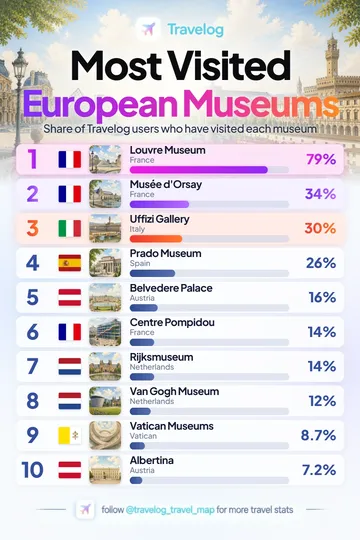
Louvre Museum leads this Travelog art museums collection at 79%, followed by Musée d'Orsay at 34%.
View image and data →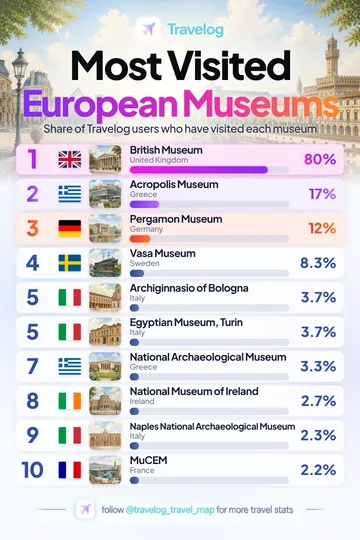
British Museum leads this Travelog history & archaeology museums collection at 80%, followed by Acropolis Museum at 17%.
View image and data →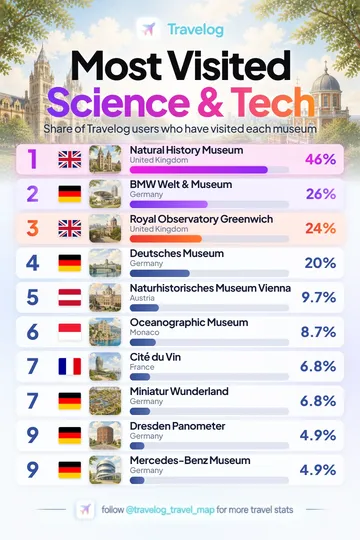
Natural History Museum leads this Travelog science, natural history & technology museums collection at 46%, followed by BMW Welt & Museum at 26%.
View image and data →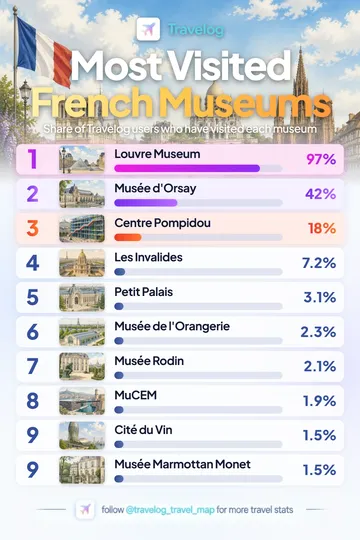
Louvre Museum leads this Travelog museums & galleries collection at 97%, followed by Musée d'Orsay at 42%.
View image and data →
Metropolitan Museum of Art leads this Travelog art museums collection at 75%, followed by The Museum of Modern Art at 35%.
View image and data →
Metropolitan Museum of Art leads this Travelog museums & galleries collection at 62%, followed by The Museum of Modern Art at 29%.
View image and data →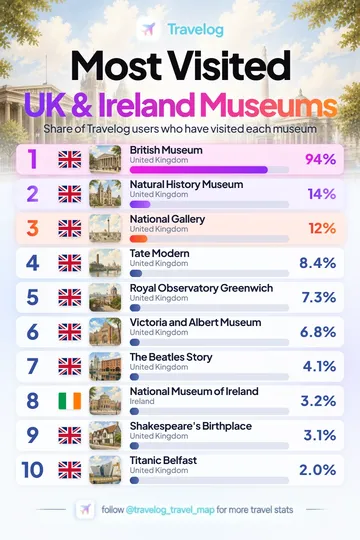
British Museum leads this Travelog museums & galleries collection at 94%, followed by Natural History Museum at 14%.
View image and data →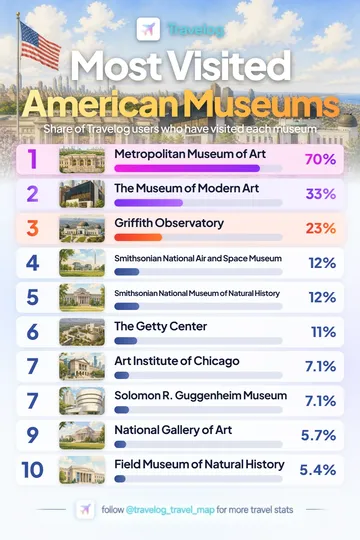
Metropolitan Museum of Art leads this Travelog museums & galleries collection at 70%, followed by The Museum of Modern Art at 33%.
View image and data →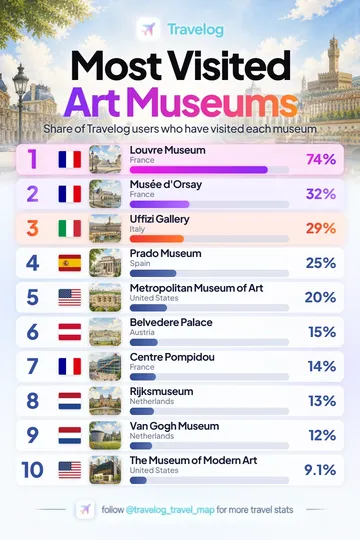
Louvre Museum leads this Travelog art museums collection at 74%, followed by Musée d'Orsay at 32%.
View image and data →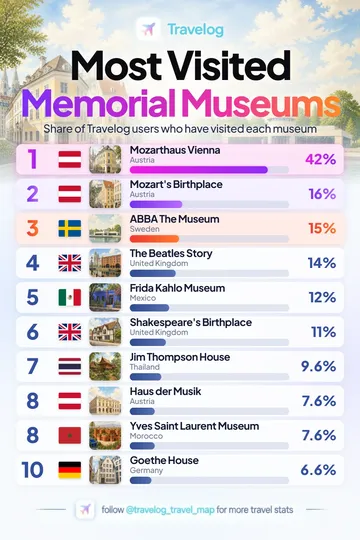
Mozarthaus Vienna leads this Travelog biographical & music museums collection at 42%, followed by Mozart's Birthplace at 16%.
View image and data →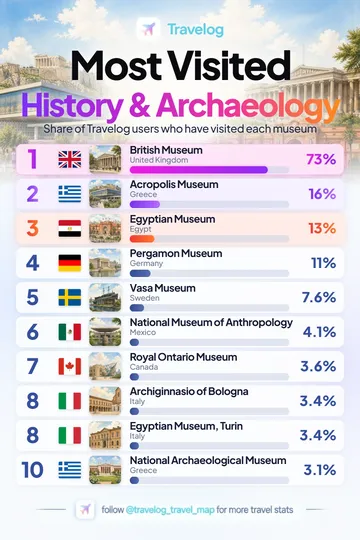
British Museum leads this Travelog history & archaeology museums collection at 73%, followed by Acropolis Museum at 16%.
View image and data →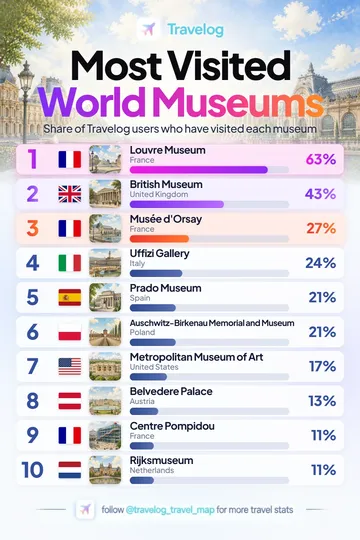
Louvre Museum leads this Travelog museums & galleries collection at 63%, followed by British Museum at 43%.
View image and data →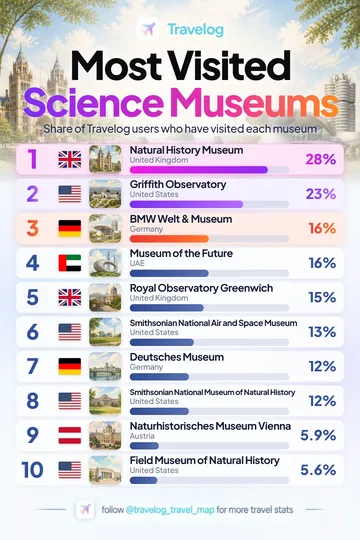
Natural History Museum leads this Travelog science, natural history & technology museums collection at 28%, followed by Griffith Observatory at 23%.
View image and data →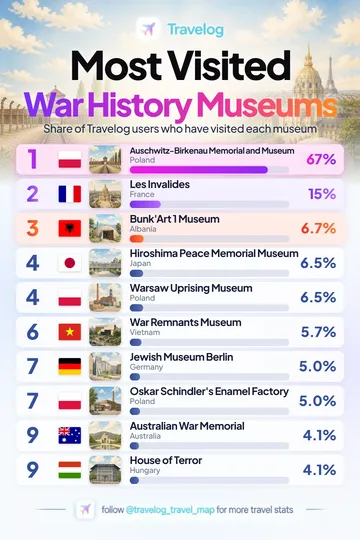
Auschwitz-Birkenau Memorial and Museum leads this Travelog war & modern history museums collection at 67%, followed by Les Invalides at 15%.
View image and data →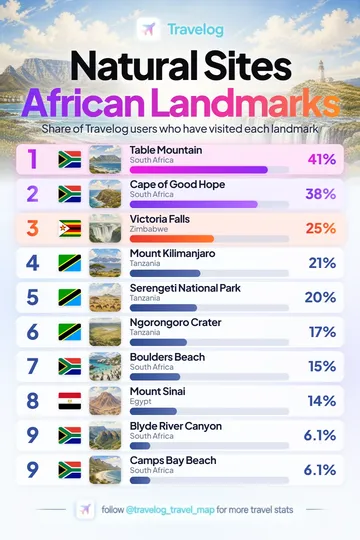
Table Mountain leads this Travelog natural attractions collection at 41%, followed by Cape of Good Hope at 38%.
View image and data →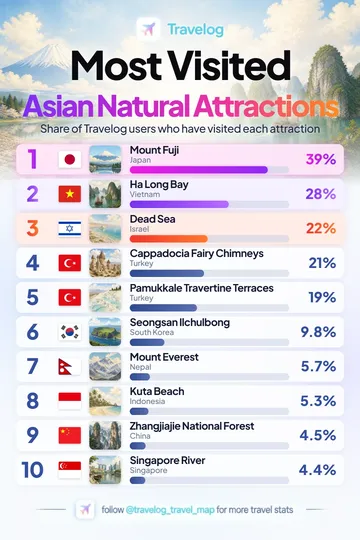
Mount Fuji leads this Travelog natural attractions collection at 39%, followed by Ha Long Bay at 28%.
View image and data →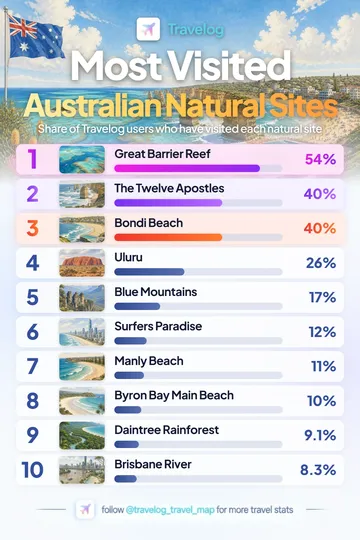
Great Barrier Reef leads this Travelog natural attractions collection at 54%, followed by The Twelve Apostles at 40%.
View image and data →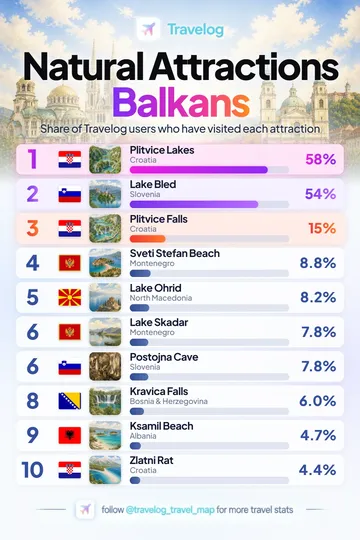
Plitvice Lakes leads this Travelog natural attractions collection at 58%, followed by Lake Bled at 54%.
View image and data →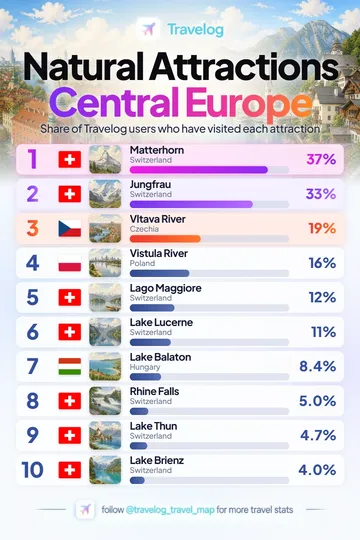
Matterhorn leads this Travelog natural attractions collection at 37%, followed by Jungfrau at 33%.
View image and data →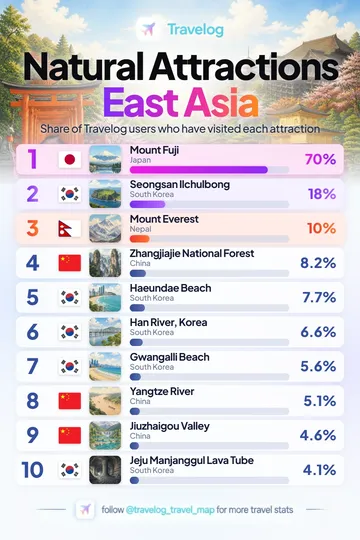
Mount Fuji leads this Travelog natural attractions collection at 70%, followed by Seongsan Ilchulbong at 18%.
View image and data →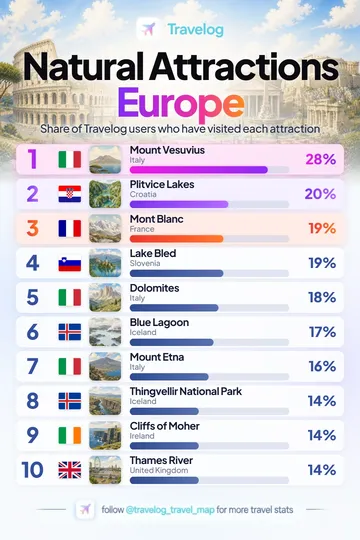
Mount Vesuvius leads this Travelog natural attractions collection at 28%, followed by Plitvice Lakes at 20%.
View image and data →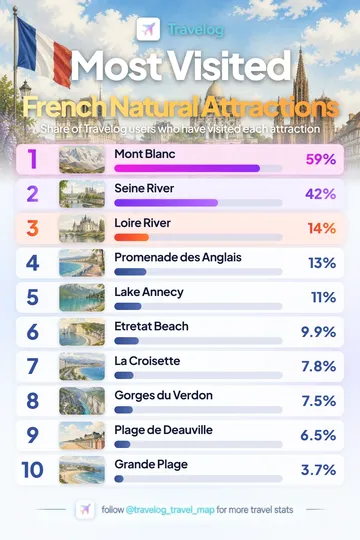
Mont Blanc leads this Travelog natural attractions collection at 59%, followed by Seine River at 42%.
View image and data →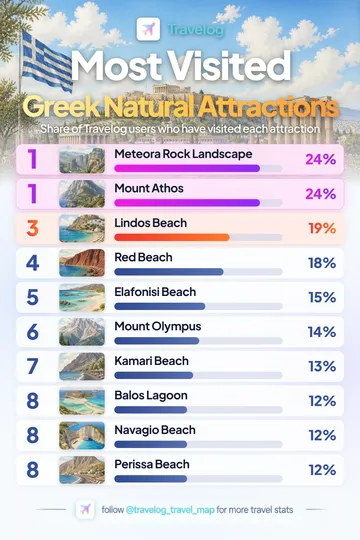
Meteora Rock Landscape leads this Travelog natural attractions collection at 24%, followed by Mount Athos at 24%.
View image and data →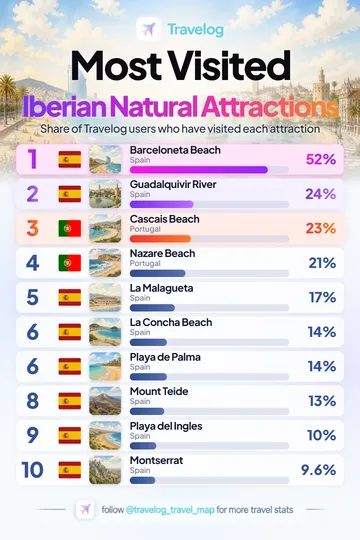
Barceloneta Beach leads this Travelog natural attractions collection at 52%, followed by Guadalquivir River at 24%.
View image and data →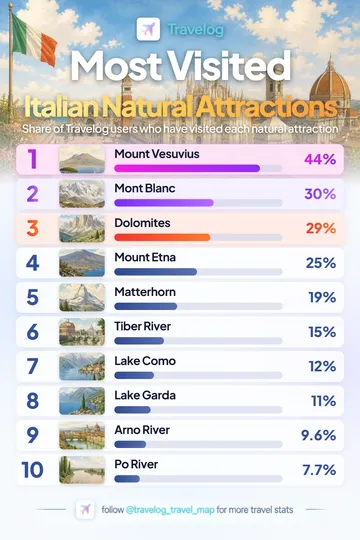
Mount Vesuvius leads this Travelog natural attractions collection at 44%, followed by Mont Blanc at 30%.
View image and data →
Niagara Falls leads this Travelog natural attractions collection at 52%, followed by Grand Canyon at 49%.
View image and data →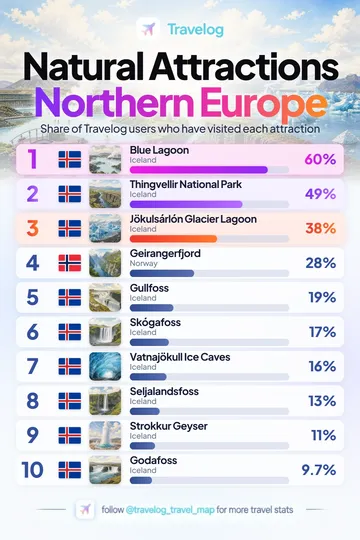
Blue Lagoon leads this Travelog natural attractions collection at 60%, followed by Thingvellir National Park at 49%.
View image and data →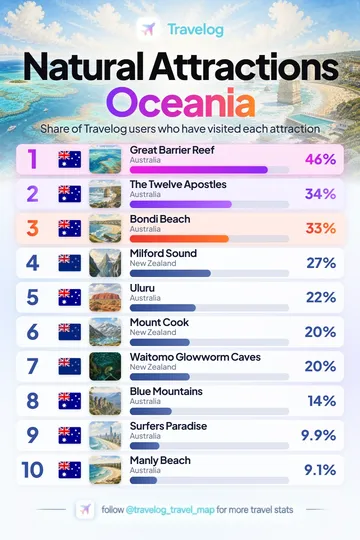
Great Barrier Reef leads this Travelog natural attractions collection at 46%, followed by The Twelve Apostles at 34%.
View image and data →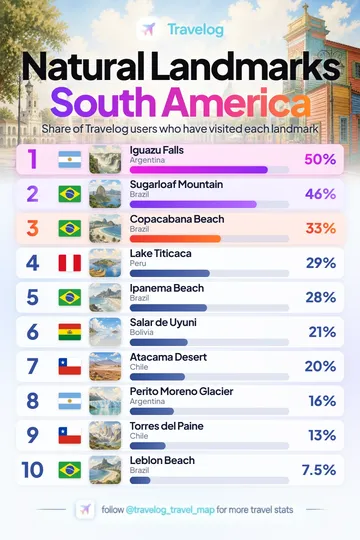
Iguazu Falls leads this Travelog natural attractions collection at 50%, followed by Sugarloaf Mountain at 46%.
View image and data →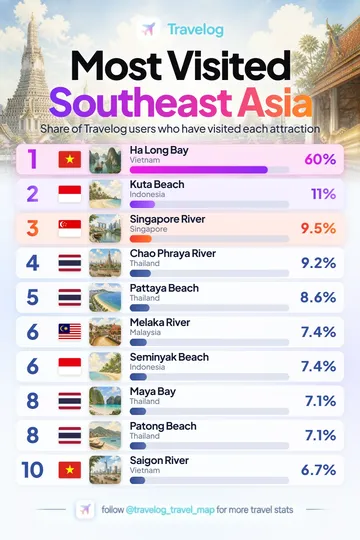
Ha Long Bay leads this Travelog natural attractions collection at 60%, followed by Kuta Beach at 11%.
View image and data →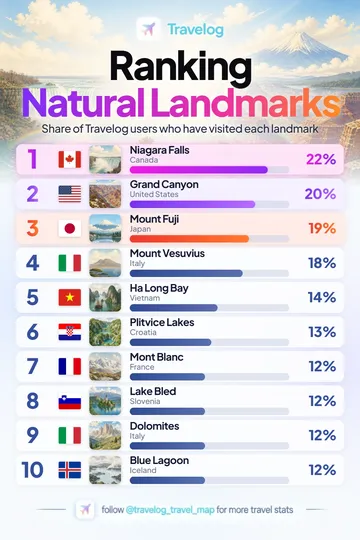
Niagara Falls leads this Travelog natural attractions collection at 22%, followed by Grand Canyon at 20%.
View image and data →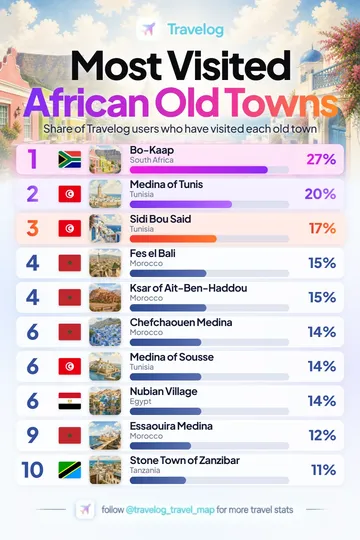
Bo-Kaap leads this Travelog old towns & traditional villages collection at 27%, followed by Medina of Tunis at 20%.
View image and data →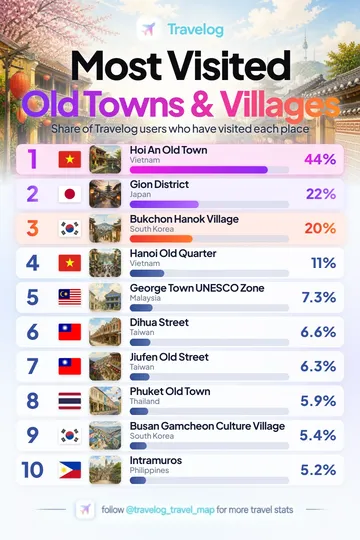
Hoi An Old Town leads this Travelog old towns & traditional villages collection at 44%, followed by Gion District at 22%.
View image and data →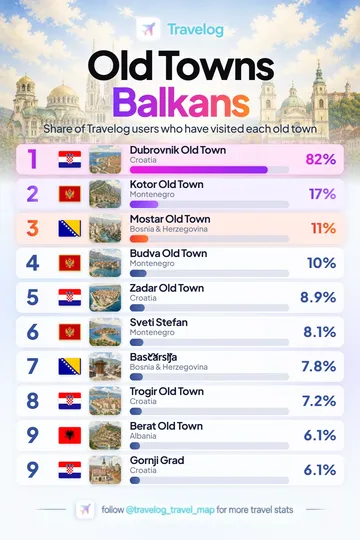
Dubrovnik Old Town leads this Travelog old towns & traditional villages collection at 82%, followed by Kotor Old Town at 17%.
View image and data →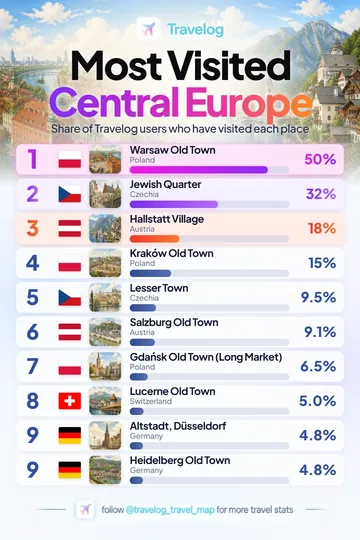
Warsaw Old Town leads this Travelog old towns & traditional villages collection at 50%, followed by Jewish Quarter at 32%.
View image and data →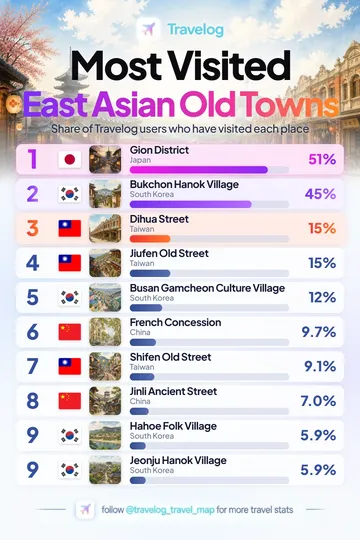
Gion District leads this Travelog old towns & traditional villages collection at 51%, followed by Bukchon Hanok Village at 45%.
View image and data →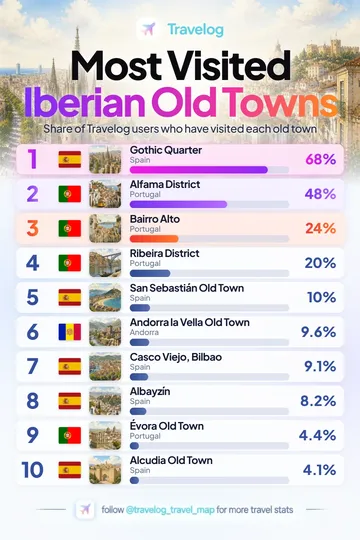
Gothic Quarter leads this Travelog old towns & traditional villages collection at 68%, followed by Alfama District at 48%.
View image and data →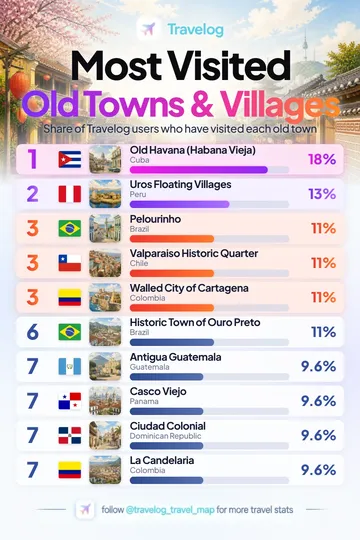
Old Havana (Habana Vieja) leads this Travelog old towns & traditional villages collection at 18%, followed by Uros Floating Villages at 13%.
View image and data →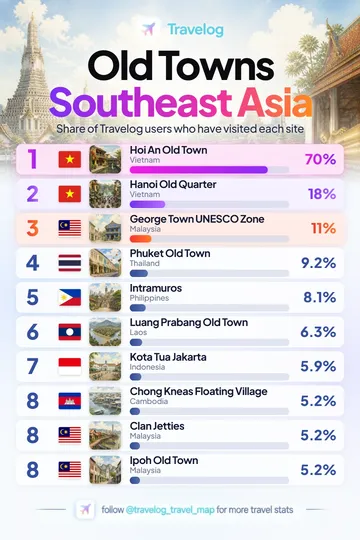
Hoi An Old Town leads this Travelog old towns & traditional villages collection at 70%, followed by Hanoi Old Quarter at 18%.
View image and data →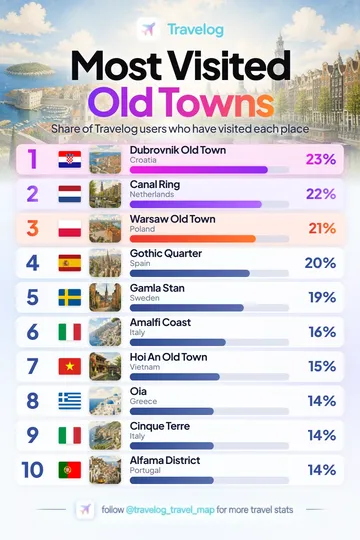
Dubrovnik Old Town leads this Travelog old towns & traditional villages collection at 23%, followed by Canal Ring at 22%.
View image and data →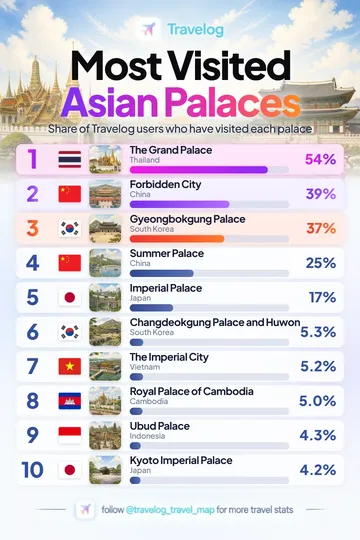
The Grand Palace leads this Travelog palaces collection at 54%, followed by Forbidden City at 39%.
View image and data →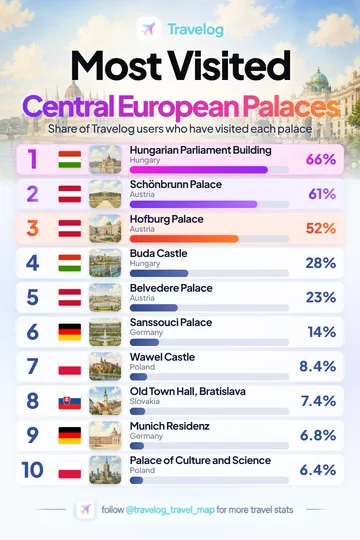
Hungarian Parliament Building leads this Travelog palaces collection at 66%, followed by Schönbrunn Palace at 61%.
View image and data →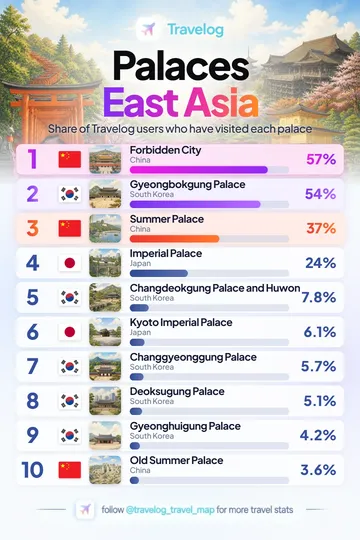
Forbidden City leads this Travelog palaces collection at 57%, followed by Gyeongbokgung Palace at 54%.
View image and data →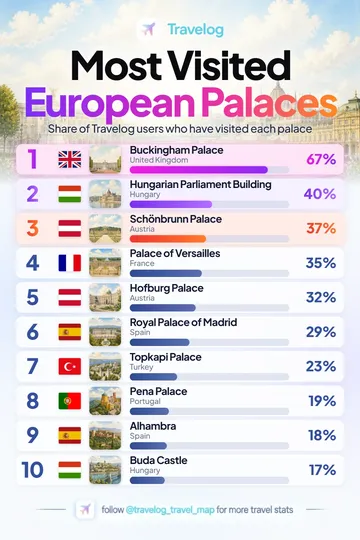
Buckingham Palace leads this Travelog palaces collection at 67%, followed by Hungarian Parliament Building at 40%.
View image and data →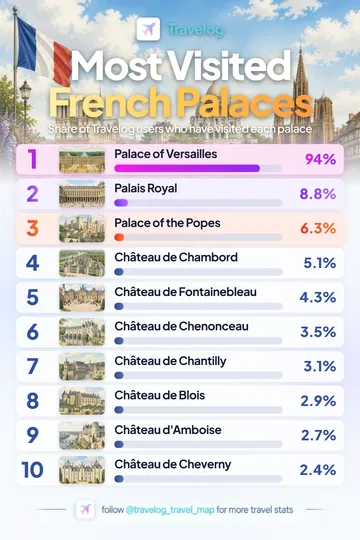
Palace of Versailles leads this Travelog palaces collection at 94%, followed by Palais Royal at 8.8%.
View image and data →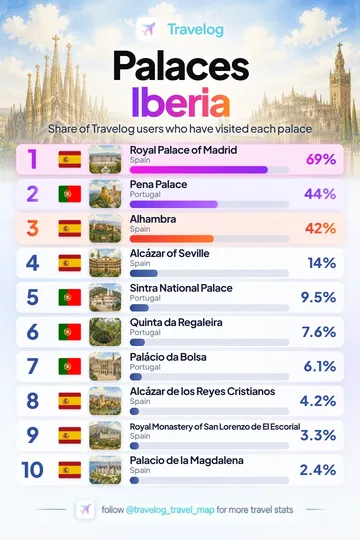
Royal Palace of Madrid leads this Travelog palaces collection at 69%, followed by Pena Palace at 44%.
View image and data →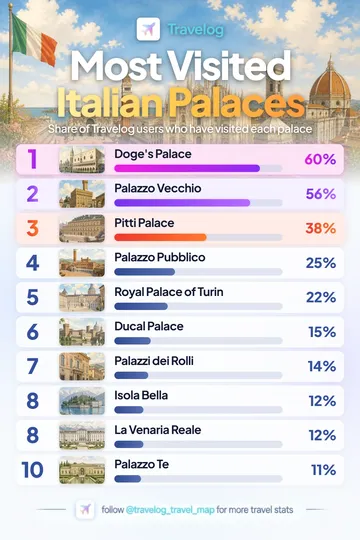
Doge's Palace leads this Travelog palaces collection at 60%, followed by Palazzo Vecchio at 56%.
View image and data →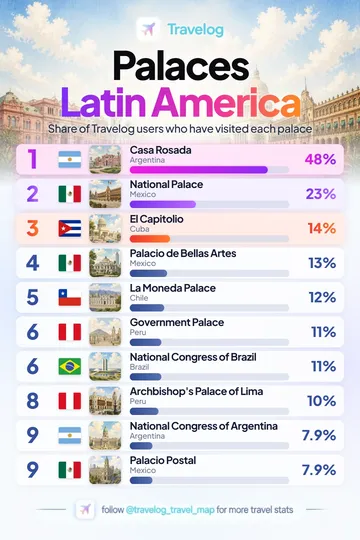
Casa Rosada leads this Travelog palaces collection at 48%, followed by National Palace at 23%.
View image and data →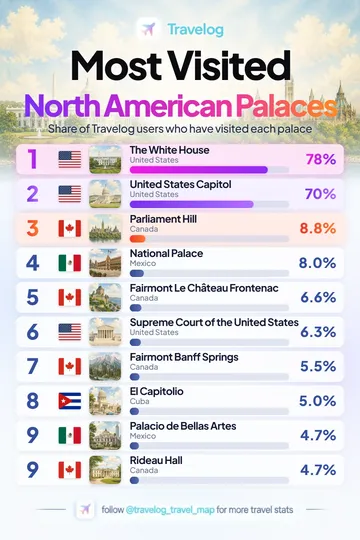
The White House leads this Travelog palaces collection at 78%, followed by United States Capitol at 70%.
View image and data →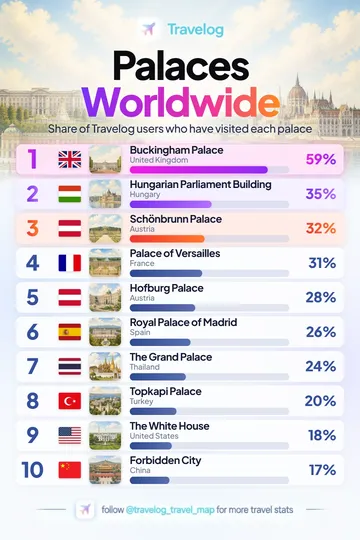
Buckingham Palace leads this Travelog palaces collection at 59%, followed by Hungarian Parliament Building at 35%.
View image and data →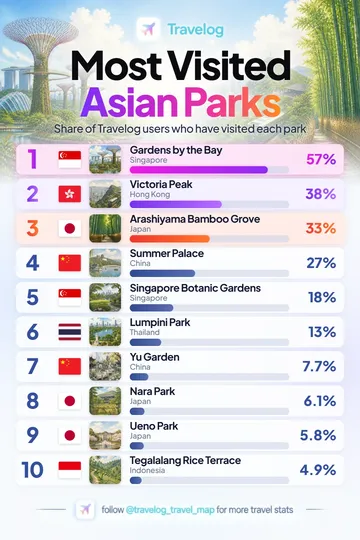
Gardens by the Bay leads this Travelog parks & gardens collection at 57%, followed by Victoria Peak at 38%.
View image and data →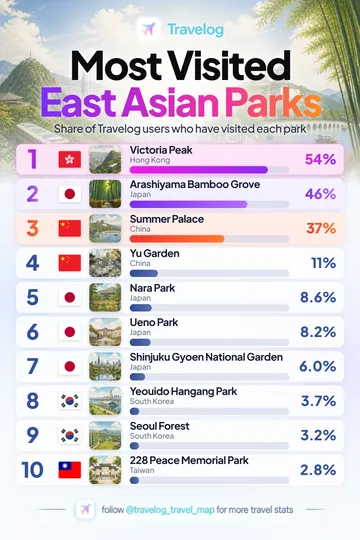
Victoria Peak leads this Travelog parks & gardens collection at 54%, followed by Arashiyama Bamboo Grove at 46%.
View image and data →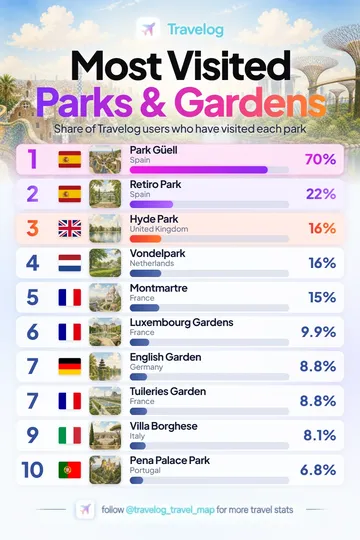
Park Güell leads this Travelog parks & gardens collection at 70%, followed by Retiro Park at 22%.
View image and data →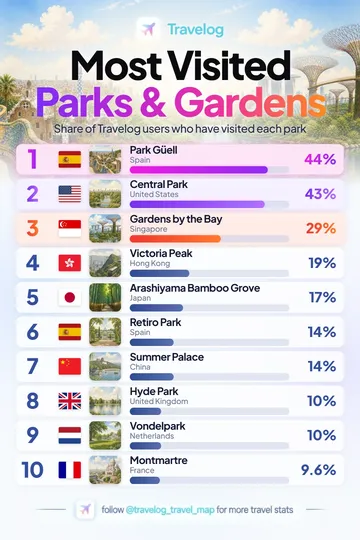
Park Güell leads this Travelog parks & gardens collection at 44%, followed by Central Park at 43%.
View image and data →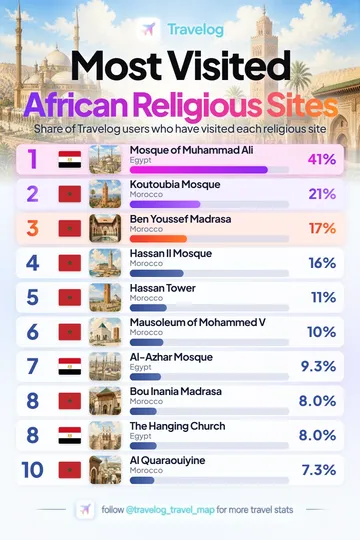
Mosque of Muhammad Ali leads this Travelog religious sites collection at 41%, followed by Koutoubia Mosque at 21%.
View image and data →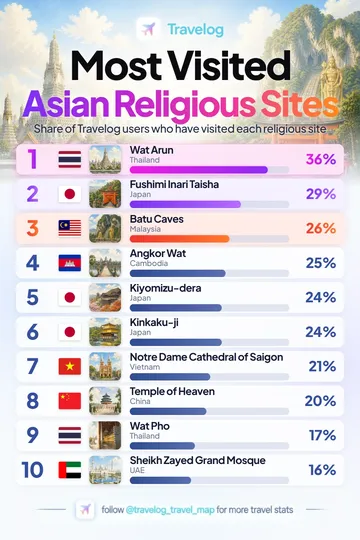
Wat Arun leads this Travelog religious sites collection at 36%, followed by Fushimi Inari Taisha at 29%.
View image and data →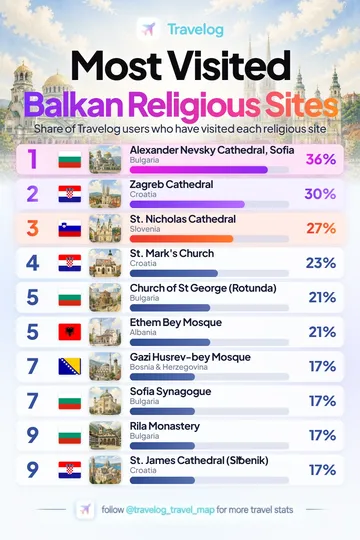
Alexander Nevsky Cathedral, Sofia leads this Travelog religious sites collection at 36%, followed by Zagreb Cathedral at 30%.
View image and data →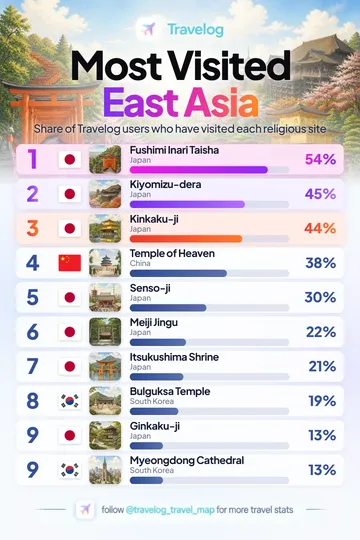
Fushimi Inari Taisha leads this Travelog religious sites collection at 54%, followed by Kiyomizu-dera at 45%.
View image and data →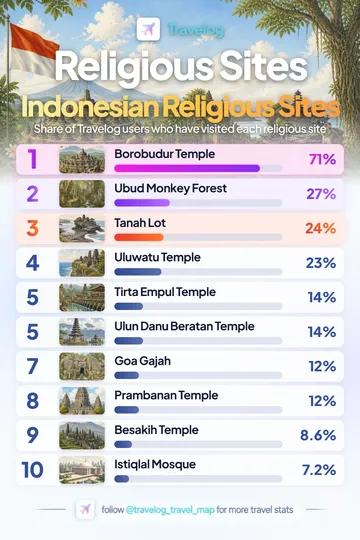
Borobudur Temple leads this Travelog religious sites collection at 71%, followed by Ubud Monkey Forest at 27%.
View image and data →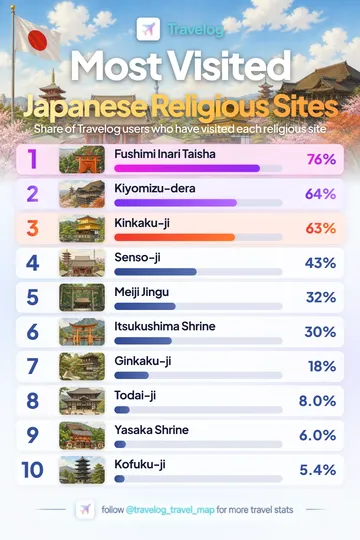
Fushimi Inari Taisha leads this Travelog religious sites collection at 76%, followed by Kiyomizu-dera at 64%.
View image and data →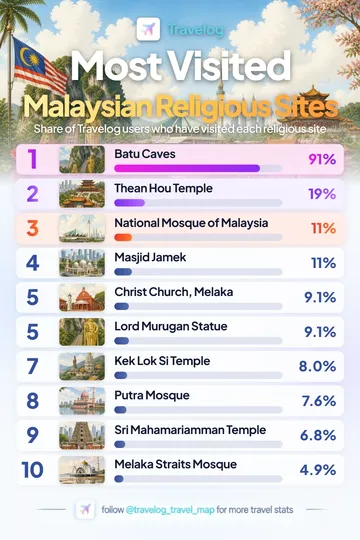
Batu Caves leads this Travelog religious sites collection at 91%, followed by Thean Hou Temple at 19%.
View image and data →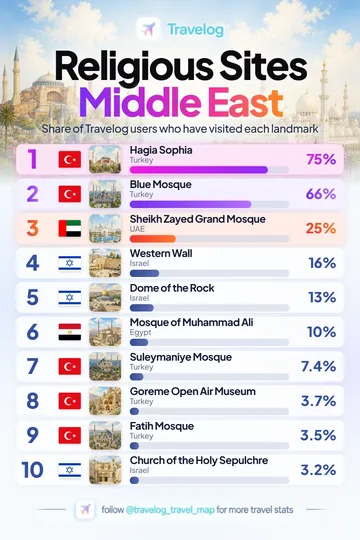
Hagia Sophia leads this Travelog religious sites collection at 75%, followed by Blue Mosque at 66%.
View image and data →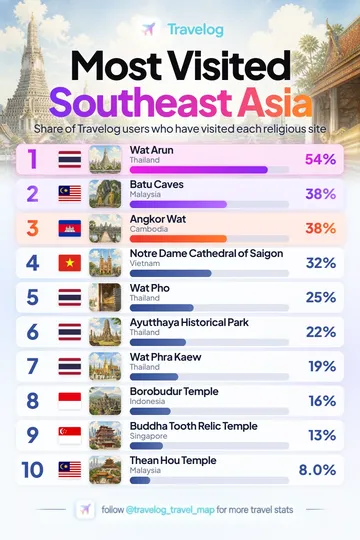
Wat Arun leads this Travelog religious sites collection at 54%, followed by Batu Caves at 38%.
View image and data →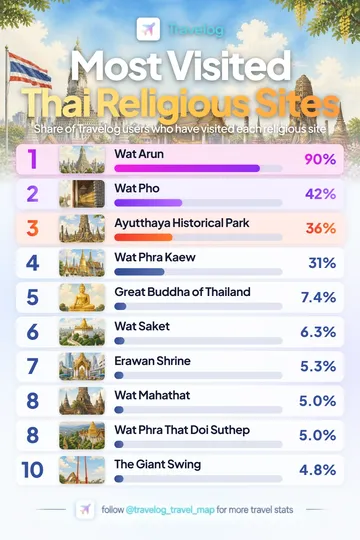
Wat Arun leads this Travelog religious sites collection at 90%, followed by Wat Pho at 42%.
View image and data →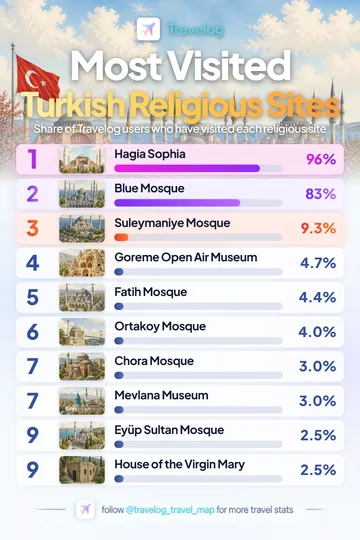
Hagia Sophia leads this Travelog religious sites collection at 96%, followed by Blue Mosque at 83%.
View image and data →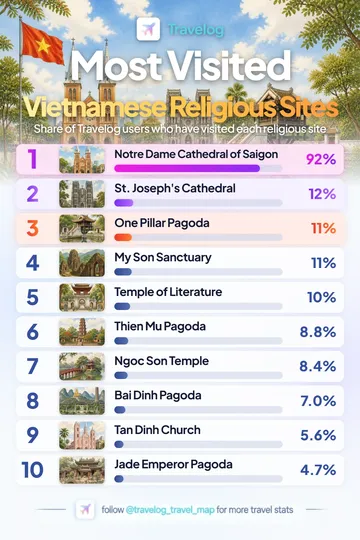
Notre Dame Cathedral of Saigon leads this Travelog religious sites collection at 92%, followed by St. Joseph's Cathedral at 12%.
View image and data →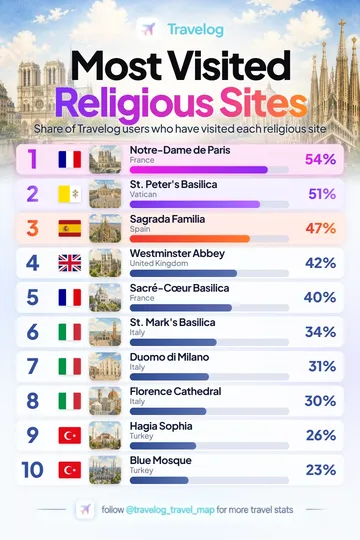
Notre-Dame de Paris leads this Travelog religious sites collection at 54%, followed by St. Peter's Basilica at 51%.
View image and data →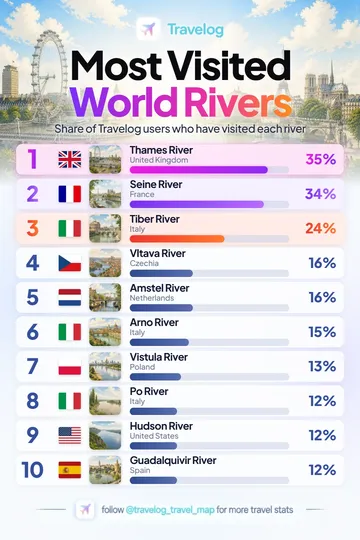
Thames River leads this Travelog rivers collection at 35%, followed by Seine River at 34%.
View image and data →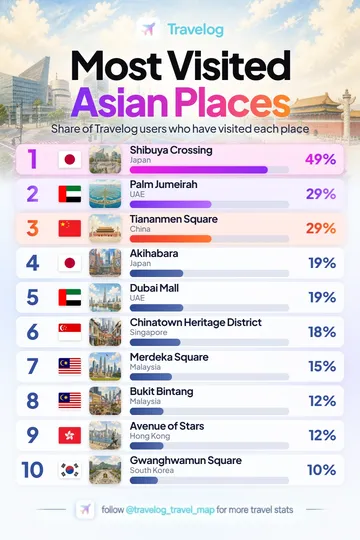
Shibuya Crossing leads this Travelog squares & streets collection at 49%, followed by Palm Jumeirah at 29%.
View image and data →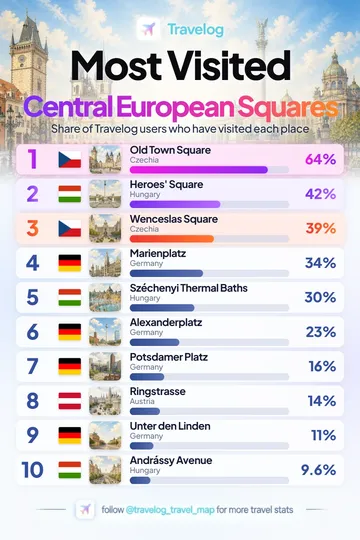
Old Town Square leads this Travelog squares & streets collection at 64%, followed by Heroes' Square at 42%.
View image and data →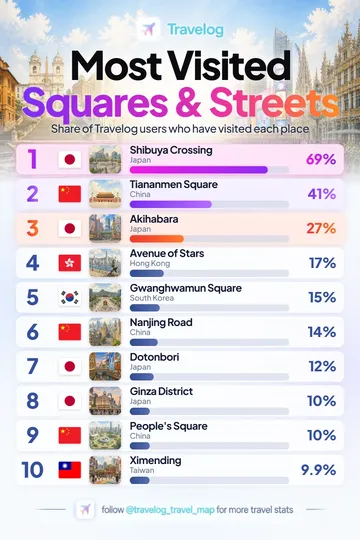
Shibuya Crossing leads this Travelog squares & streets collection at 69%, followed by Tiananmen Square at 41%.
View image and data →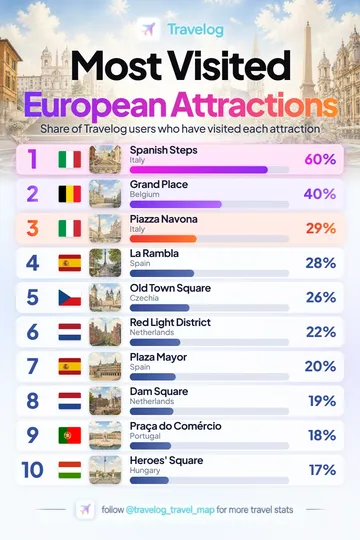
Spanish Steps leads this Travelog squares & streets collection at 60%, followed by Grand Place at 40%.
View image and data →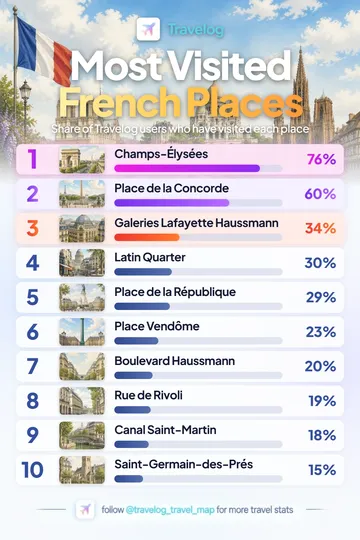
Champs-Élysées leads this Travelog squares & streets collection at 76%, followed by Place de la Concorde at 60%.
View image and data →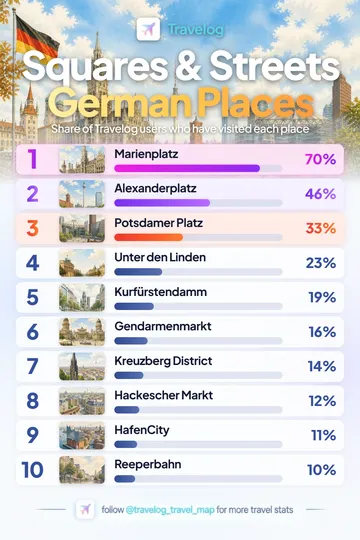
Marienplatz leads this Travelog squares & streets collection at 70%, followed by Alexanderplatz at 46%.
View image and data →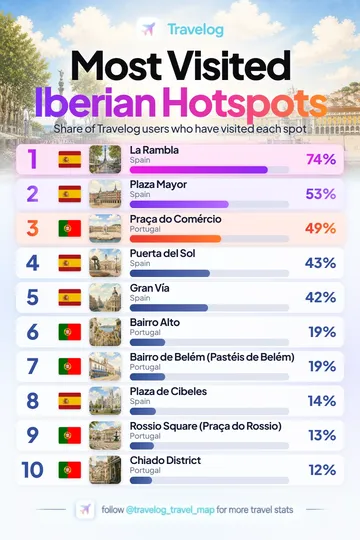
La Rambla leads this Travelog squares & streets collection at 74%, followed by Plaza Mayor at 53%.
View image and data →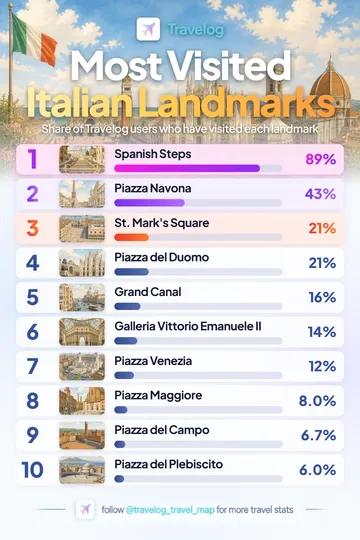
Spanish Steps leads this Travelog squares & streets collection at 89%, followed by Piazza Navona at 43%.
View image and data →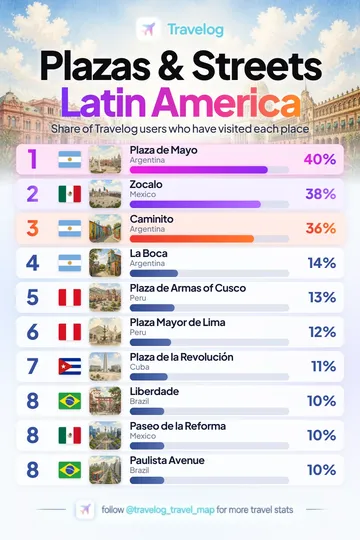
Plaza de Mayo leads this Travelog squares & streets collection at 40%, followed by Zocalo at 38%.
View image and data →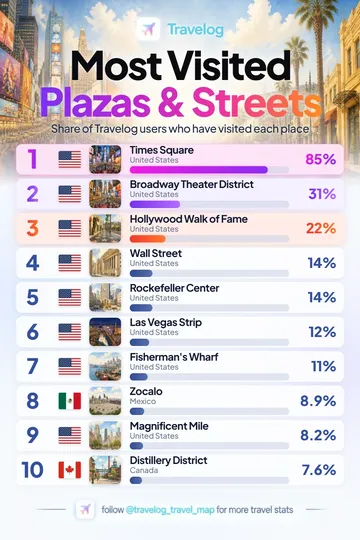
Times Square leads this Travelog squares & streets collection at 85%, followed by Broadway Theater District at 31%.
View image and data →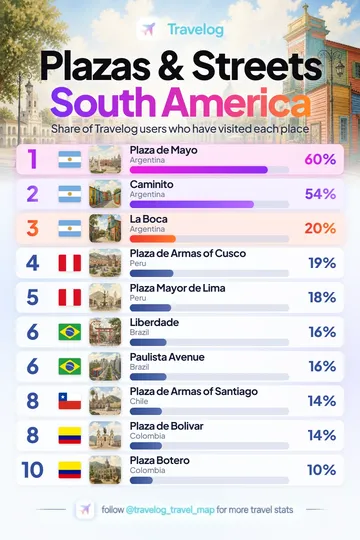
Plaza de Mayo leads this Travelog squares & streets collection at 60%, followed by Caminito at 54%.
View image and data →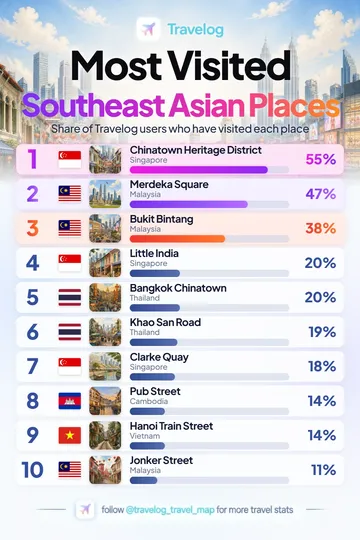
Chinatown Heritage District leads this Travelog squares & streets collection at 55%, followed by Merdeka Square at 47%.
View image and data →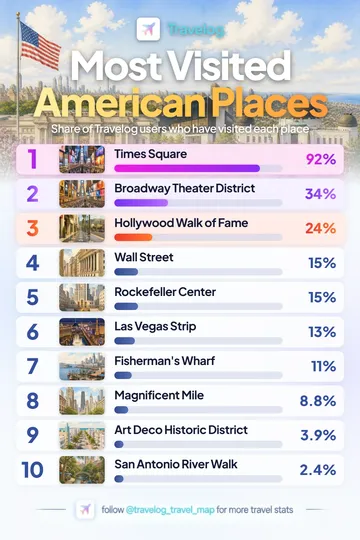
Times Square leads this Travelog squares & streets collection at 92%, followed by Broadway Theater District at 34%.
View image and data →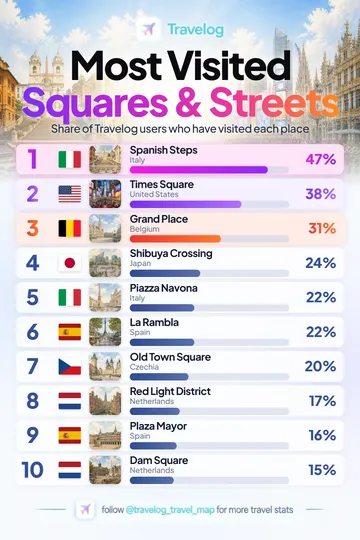
Spanish Steps leads this Travelog squares & streets collection at 47%, followed by Times Square at 38%.
View image and data →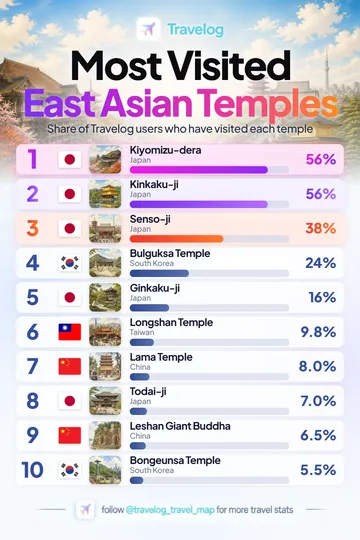
Kiyomizu-dera leads this Travelog buddhist temples collection at 56%, followed by Kinkaku-ji at 56%.
View image and data →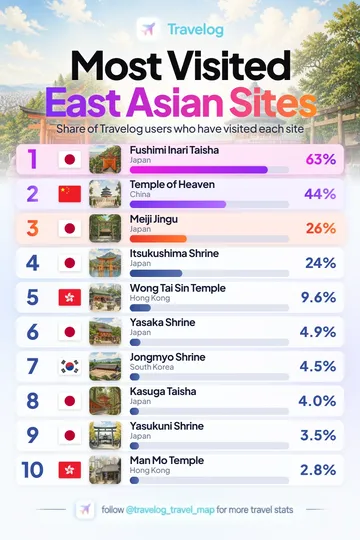
Fushimi Inari Taisha leads this Travelog shinto, taoist & other religious sites collection at 63%, followed by Temple of Heaven at 44%.
View image and data →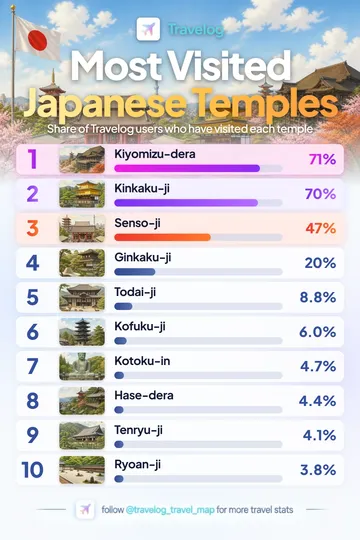
Kiyomizu-dera leads this Travelog buddhist temples collection at 71%, followed by Kinkaku-ji at 70%.
View image and data →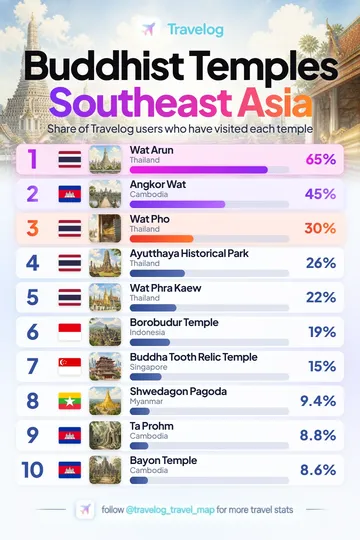
Wat Arun leads this Travelog buddhist temples collection at 65%, followed by Angkor Wat at 45%.
View image and data →
Wat Arun leads this Travelog buddhist temples collection at 90%, followed by Wat Pho at 42%.
View image and data →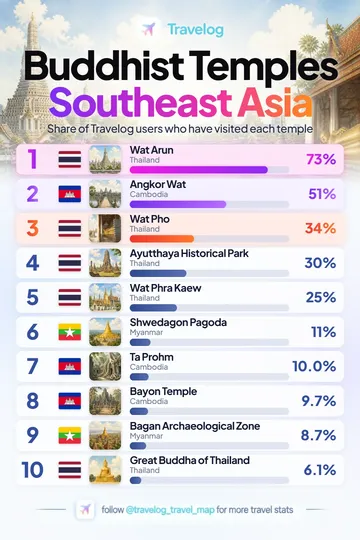
Wat Arun leads this Travelog buddhist temples collection at 73%, followed by Angkor Wat at 51%.
View image and data →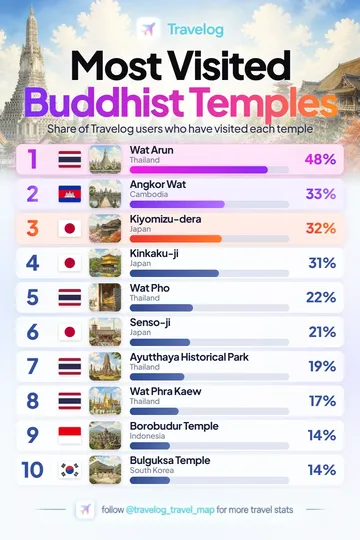
Wat Arun leads this Travelog buddhist temples collection at 48%, followed by Angkor Wat at 33%.
View image and data →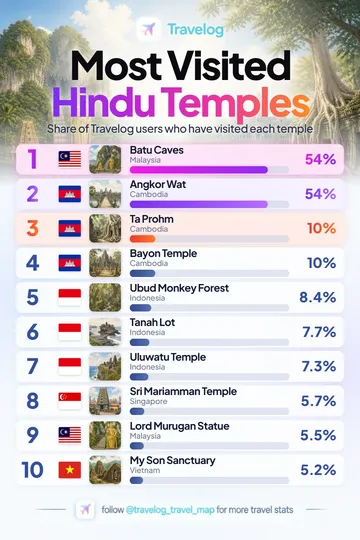
Batu Caves leads this Travelog hindu temples collection at 54%, followed by Angkor Wat at 54%.
View image and data →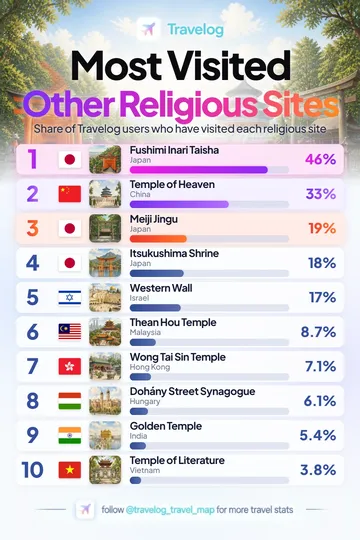
Fushimi Inari Taisha leads this Travelog shinto, taoist & other religious sites collection at 46%, followed by Temple of Heaven at 33%.
View image and data →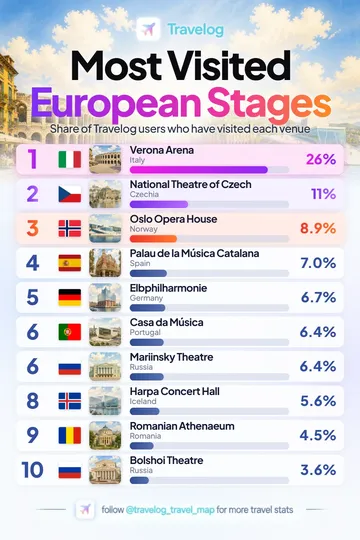
Verona Arena leads this Travelog theatres & performance venues collection at 26%, followed by National Theatre of Czech at 11%.
View image and data →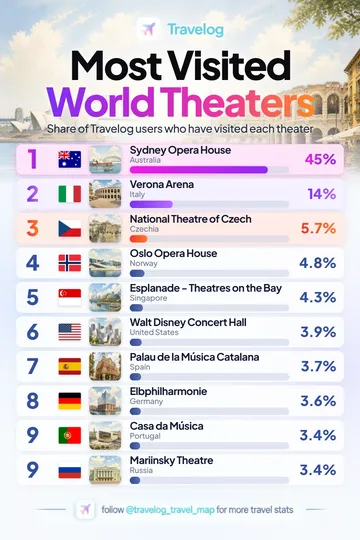
Sydney Opera House leads this Travelog theatres & performance venues collection at 45%, followed by Verona Arena at 14%.
View image and data →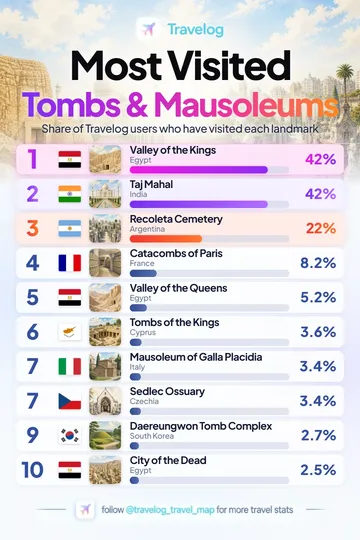
Valley of the Kings leads this Travelog tombs & mausoleums collection at 42%, followed by Taj Mahal at 42%.
View image and data →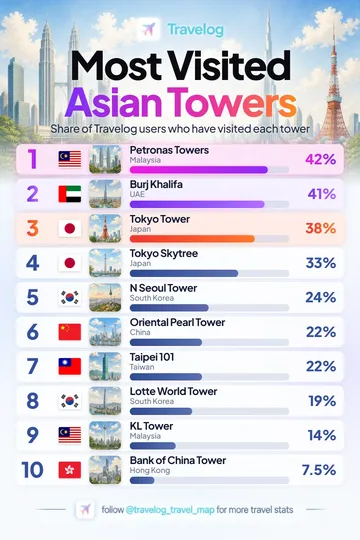
Petronas Towers leads this Travelog towers & skyscrapers collection at 42%, followed by Burj Khalifa at 41%.
View image and data →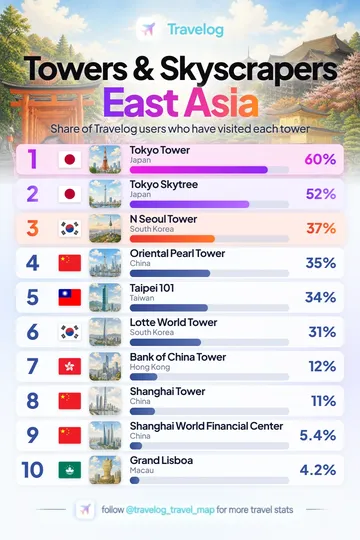
Tokyo Tower leads this Travelog towers & skyscrapers collection at 60%, followed by Tokyo Skytree at 52%.
View image and data →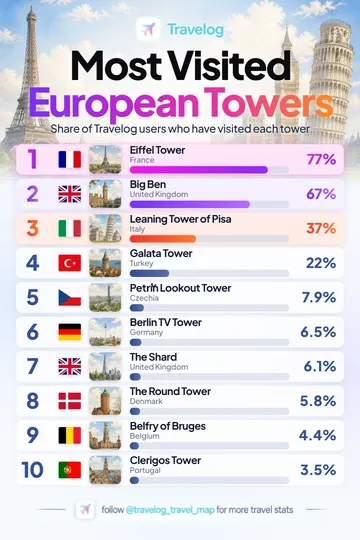
Eiffel Tower leads this Travelog towers & skyscrapers collection at 77%, followed by Big Ben at 67%.
View image and data →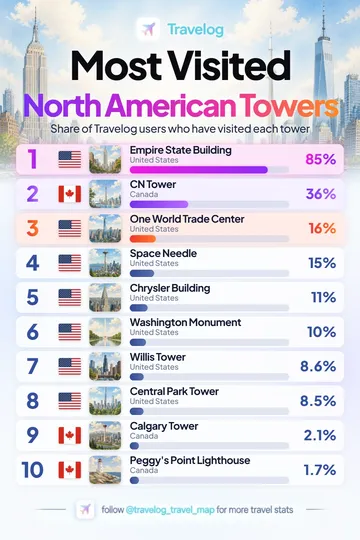
Empire State Building leads this Travelog towers & skyscrapers collection at 85%, followed by CN Tower at 36%.
View image and data →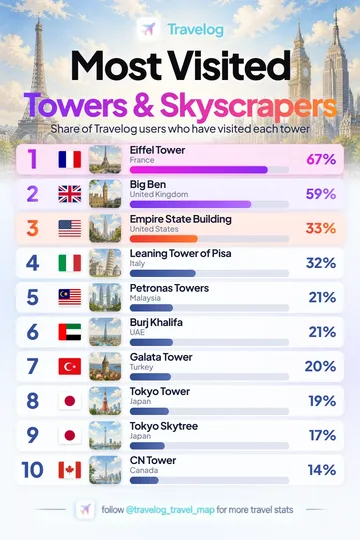
Eiffel Tower leads this Travelog towers & skyscrapers collection at 67%, followed by Big Ben at 59%.
View image and data →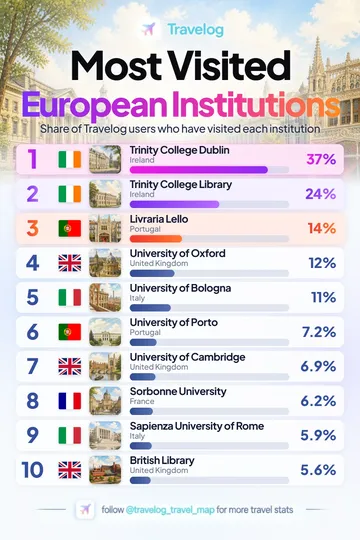
Trinity College Dublin leads this Travelog universities & libraries collection at 37%, followed by Trinity College Library at 24%.
View image and data →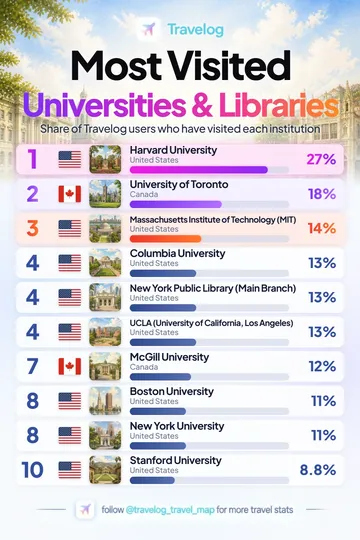
Harvard University leads this Travelog universities & libraries collection at 27%, followed by University of Toronto at 18%.
View image and data →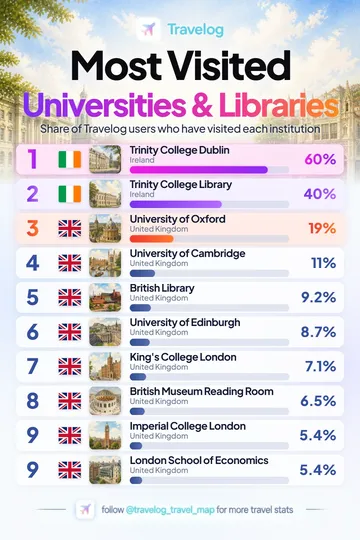
Trinity College Dublin leads this Travelog universities & libraries collection at 60%, followed by Trinity College Library at 40%.
View image and data →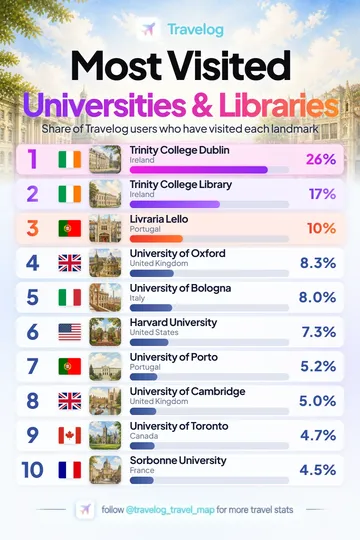
Trinity College Dublin leads this Travelog universities & libraries collection at 26%, followed by Trinity College Library at 17%.
View image and data →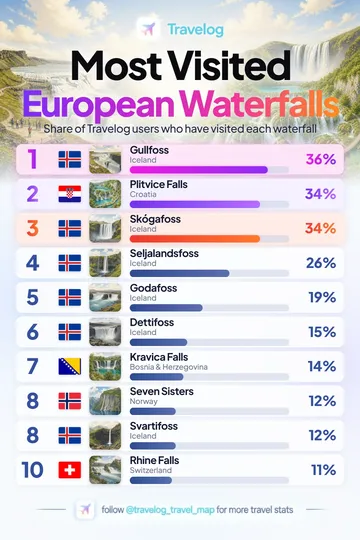
Gullfoss leads this Travelog waterfalls collection at 36%, followed by Plitvice Falls at 34%.
View image and data →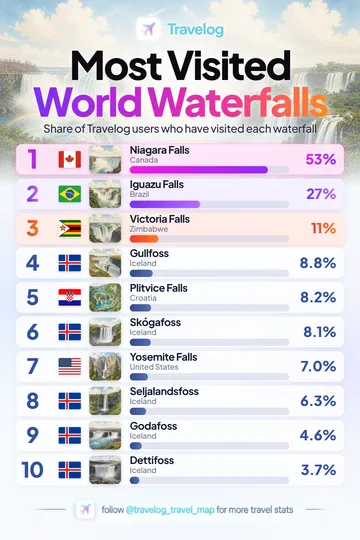
Niagara Falls leads this Travelog waterfalls collection at 53%, followed by Iguazu Falls at 27%.
View image and data →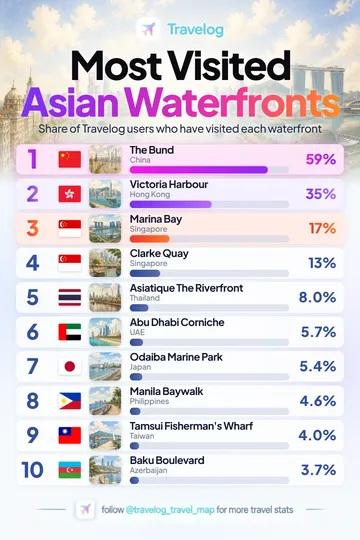
The Bund leads this Travelog harbours, canals & waterfronts collection at 59%, followed by Victoria Harbour at 35%.
View image and data →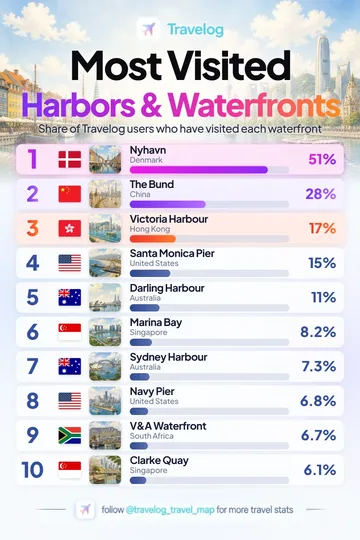
Nyhavn leads this Travelog harbours, canals & waterfronts collection at 51%, followed by The Bund at 28%.
View image and data →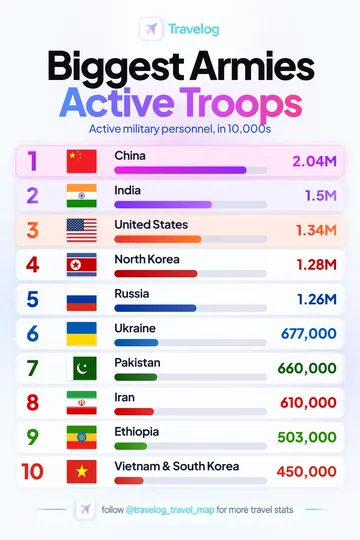
China is listed first at 2.04M in this supplied graphic. Active military personnel, in 10,000s.
View image and data →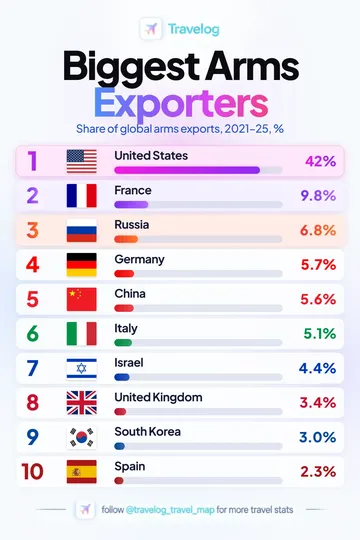
United States is listed first at 42% in this supplied graphic. Share of global arms exports, 2021–25, %.
View image and data →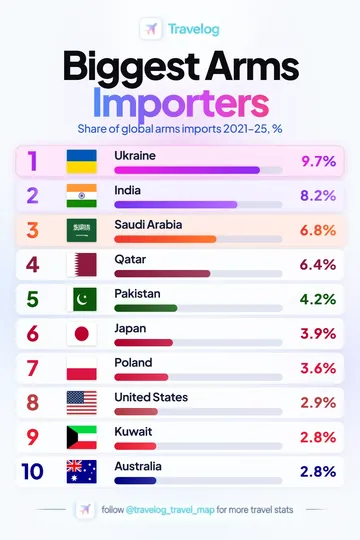
Ukraine is listed first at 9.7% in this supplied graphic. Share of global arms imports 2021–25, %.
View image and data →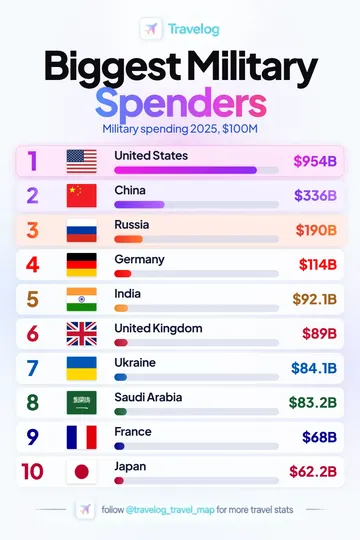
United States is listed first at $954B in this supplied graphic. Military spending 2025, $100M.
View image and data →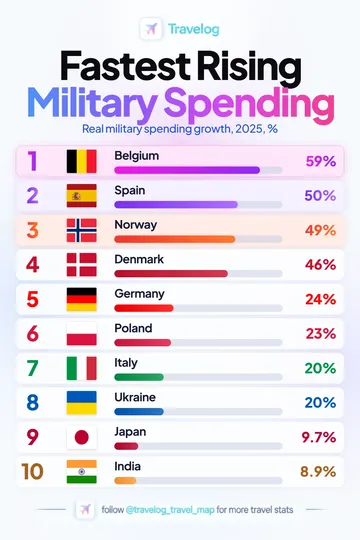
Belgium is listed first at 59% in this supplied graphic. Real military spending growth, 2025, %.
View image and data →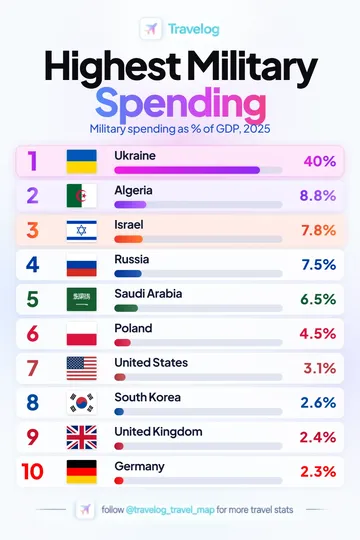
Ukraine is listed first at 40% in this supplied graphic. Military spending as % of GDP, 2025.
View image and data →
Lockheed Martin is listed first at $64.7B in this supplied graphic. Defense revenue, 2024, $100M.
View image and data →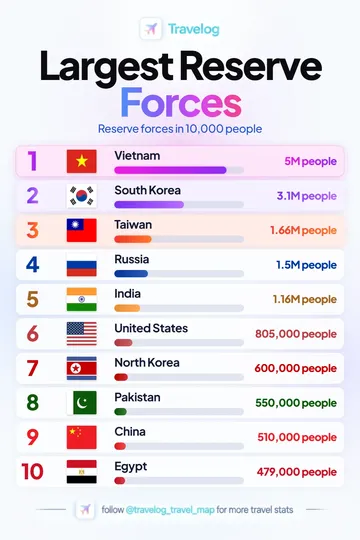
Vietnam is listed first at 5M people in this supplied graphic. Reserve forces in 10,000 people.
View image and data →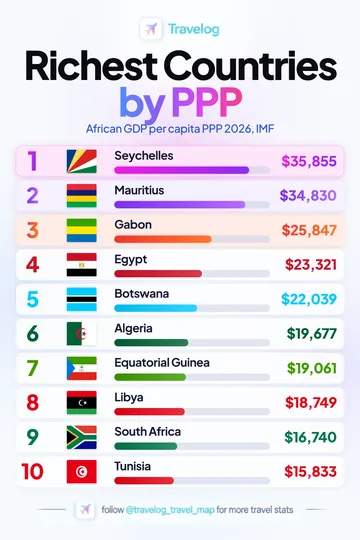
Seychelles is listed first at $35,855 in the supplied Africa GDP per capita (PPP) chart.
View image and data →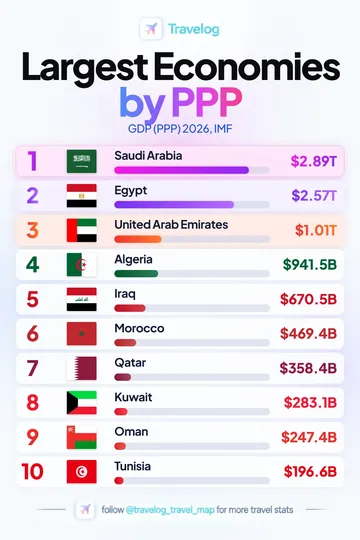
Saudi Arabia is listed first at $2.89T in the supplied Arab League GDP (PPP) chart.
View image and data →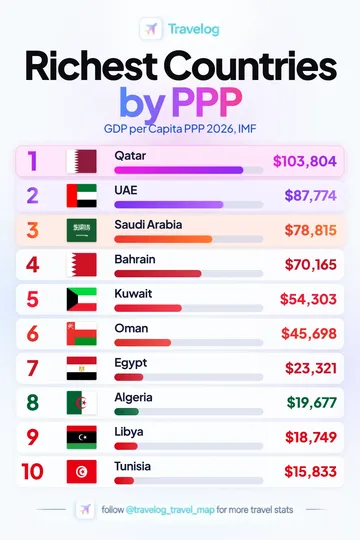
Qatar is listed first at $103,804 in the supplied Arab League GDP per capita (PPP) chart.
View image and data →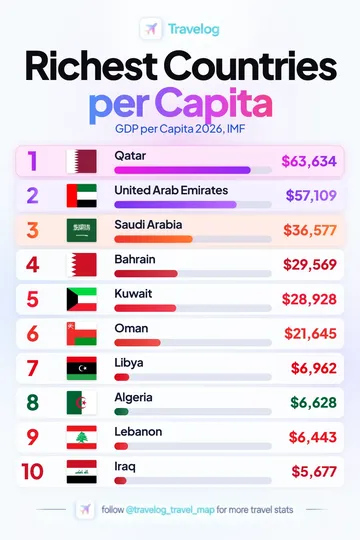
Qatar is listed first at $63,634 in the supplied Arab League GDP per capita chart.
View image and data →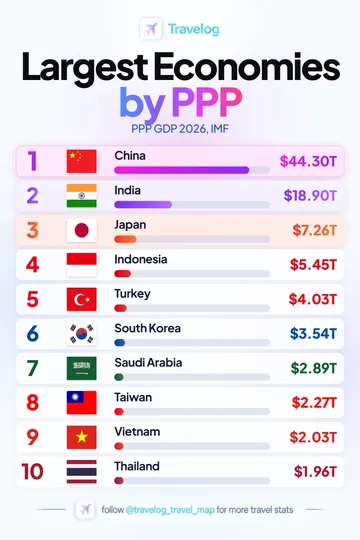
China is listed first at $44.30T in the supplied Asia GDP (PPP) chart.
View image and data →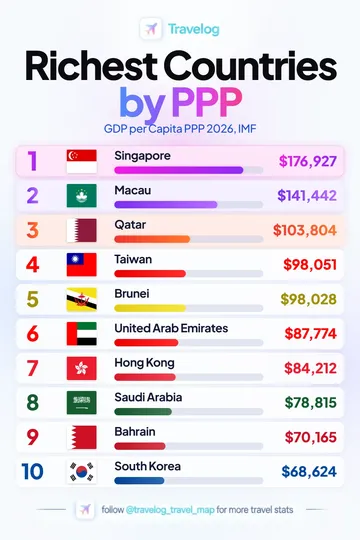
Singapore is listed first at $176,927 in the supplied Asia GDP per capita (PPP) chart.
View image and data →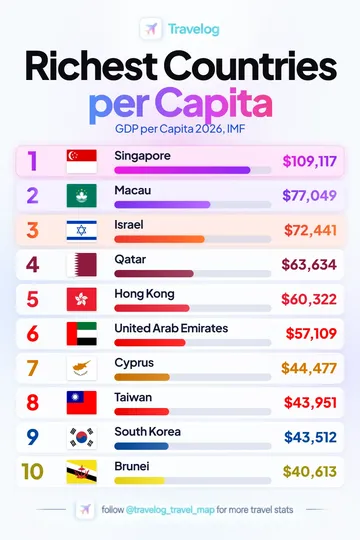
Singapore is listed first at $109,117 in the supplied Asia GDP per capita chart.
View image and data →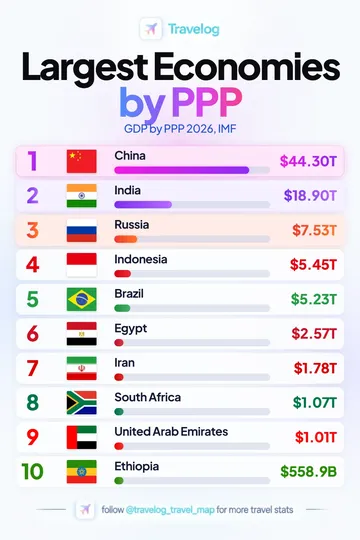
China is listed first at $44.30T in the supplied BRICS GDP (PPP) chart.
View image and data →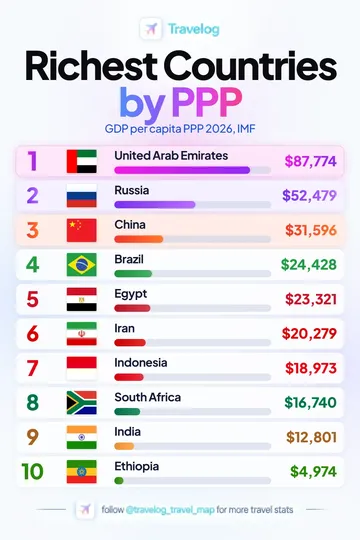
United Arab Emirates is listed first at $87,774 in the supplied BRICS GDP per capita (PPP) chart.
View image and data →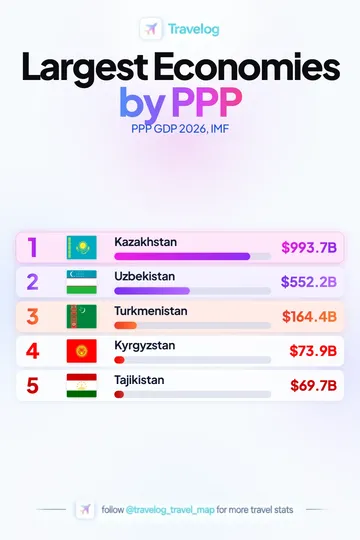
Kazakhstan is listed first at $993.7B in the supplied Central Asia GDP (PPP) chart.
View image and data →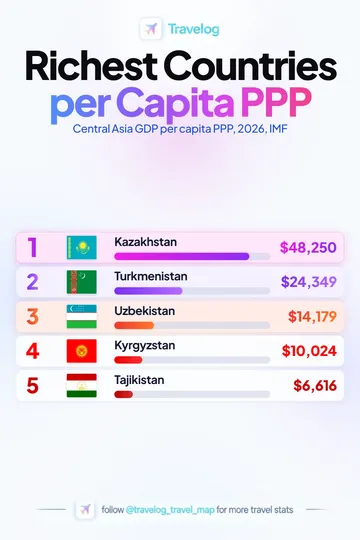
Kazakhstan is listed first at $48,250 in the supplied Central Asia GDP per capita (PPP) chart.
View image and data →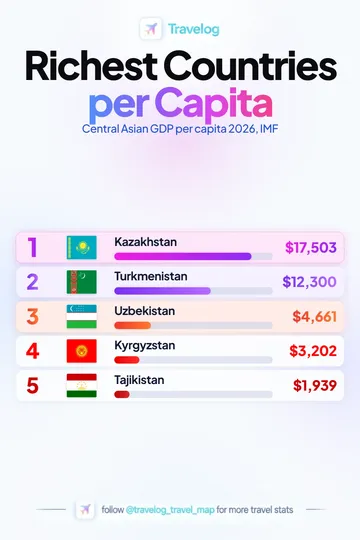
Kazakhstan is listed first at $17,503 in the supplied Central Asia GDP per capita chart.
View image and data →
China is listed first at $44.30T in the supplied East Asia GDP (PPP) chart.
View image and data →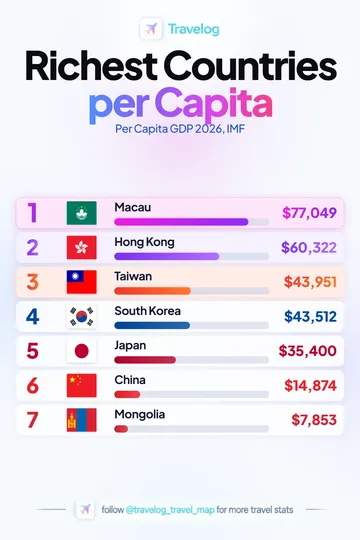
Macau is listed first at $77,049 in the supplied East Asia GDP per capita chart.
View image and data →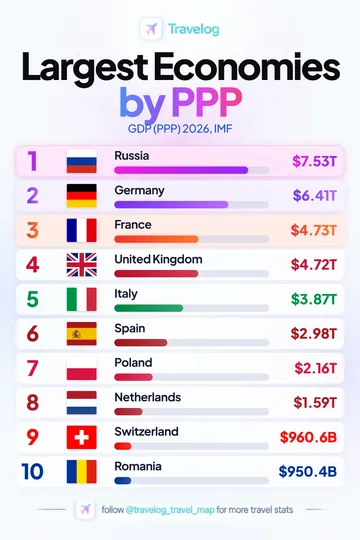
Russia is listed first at $7.53T in the supplied Europe GDP (PPP) chart.
View image and data →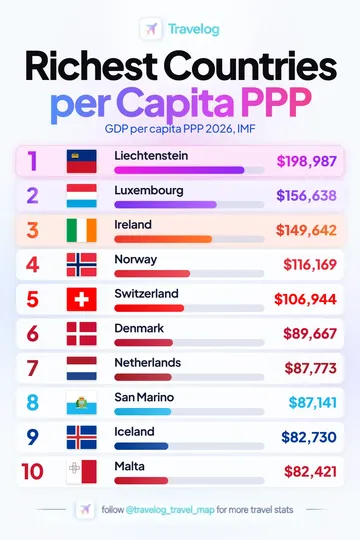
Liechtenstein is listed first at $198,987 in the supplied Europe GDP per capita (PPP) chart.
View image and data →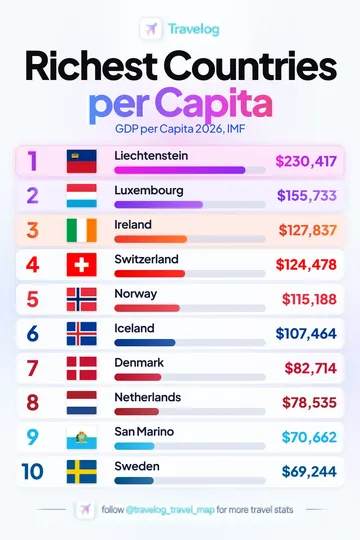
Liechtenstein is listed first at $230,417 in the supplied Europe GDP per capita chart.
View image and data →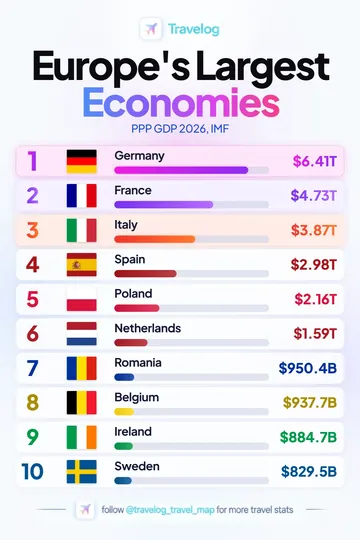
Germany is listed first at $6.41T in the supplied European Union GDP (PPP) chart.
View image and data →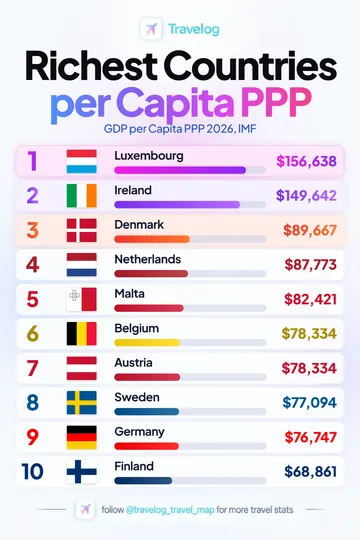
Luxembourg is listed first at $156,638 in the supplied European Union GDP per capita (PPP) chart.
View image and data →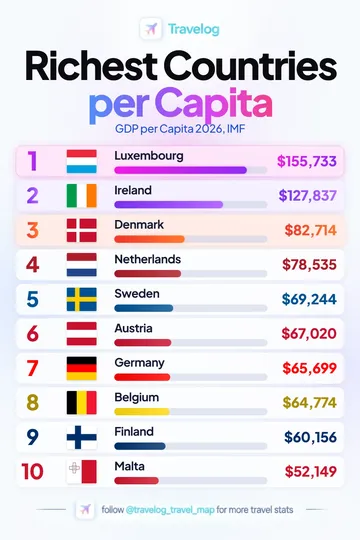
Luxembourg is listed first at $155,733 in the supplied European Union GDP per capita chart.
View image and data →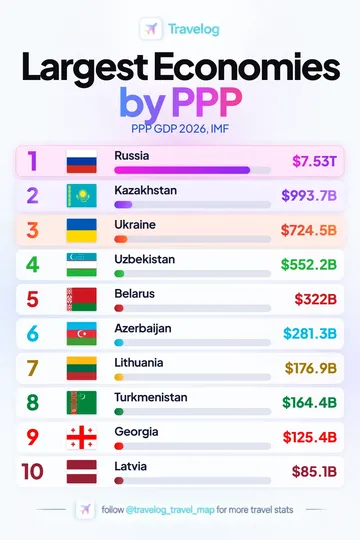
Russia is listed first at $7.53T in the supplied Former Soviet states GDP (PPP) chart.
View image and data →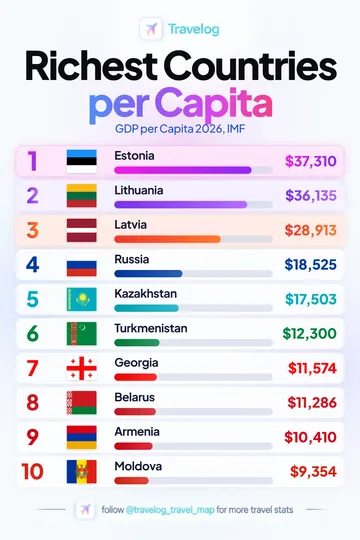
Estonia is listed first at $37,310 in the supplied Former Soviet states GDP per capita chart.
View image and data →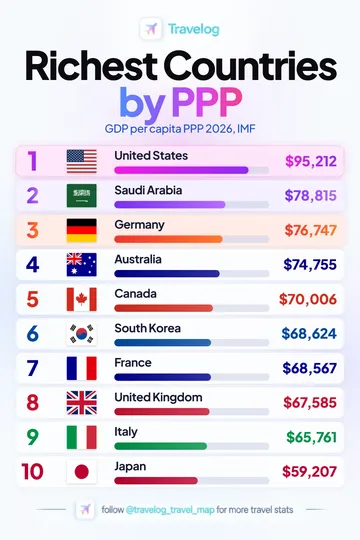
United States is listed first at $95,212 in the supplied G20 GDP per capita (PPP) chart.
View image and data →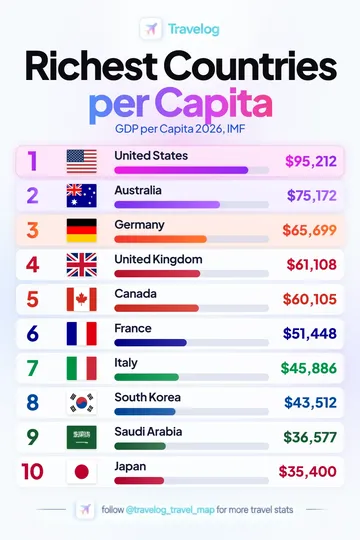
United States is listed first at $95,212 in the supplied G20 GDP per capita chart.
View image and data →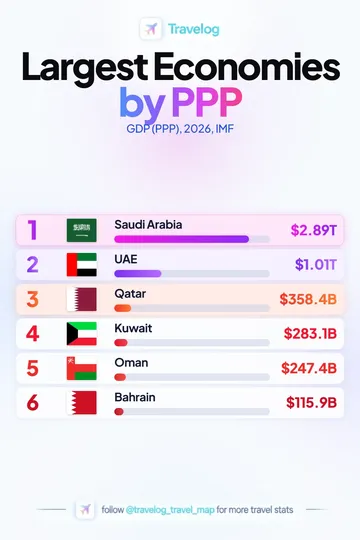
Saudi Arabia is listed first at $2.89T in the supplied GCC GDP (PPP) chart.
View image and data →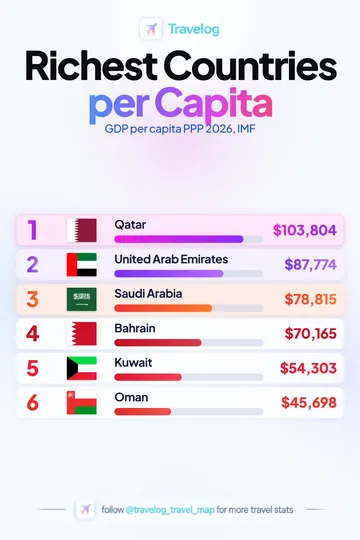
Qatar is listed first at $103,804 in the supplied GCC GDP per capita (PPP) chart.
View image and data →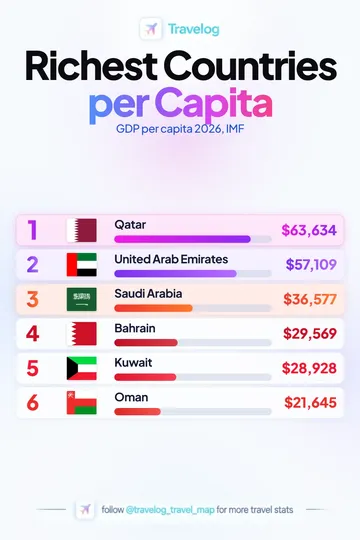
Qatar is listed first at $63,634 in the supplied GCC GDP per capita chart.
View image and data →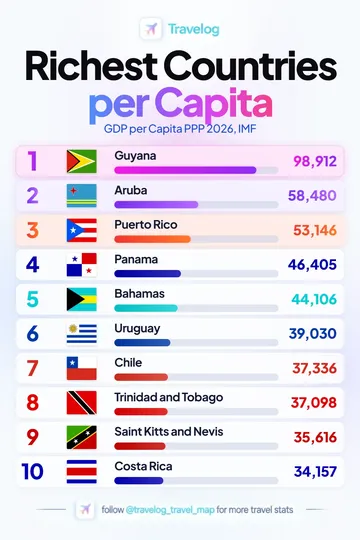
Guyana is listed first at 98,912 in the supplied Latin America and Caribbean GDP per capita (PPP) chart.
View image and data →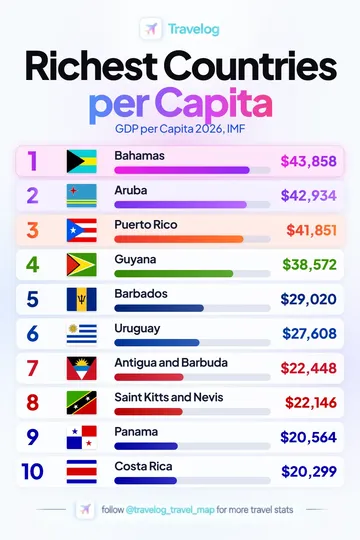
Bahamas is listed first at $43,858 in the supplied Latin America and Caribbean GDP per capita chart.
View image and data →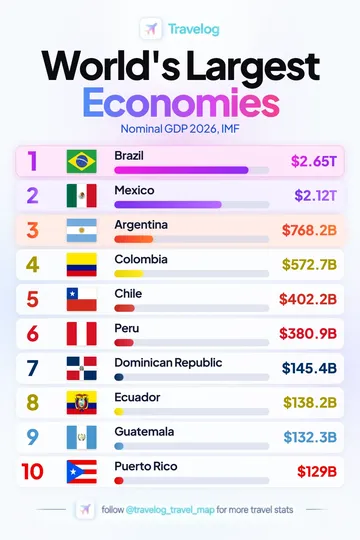
Brazil is listed first at $2.65T in the supplied Latin America and Caribbean Nominal GDP chart.
View image and data →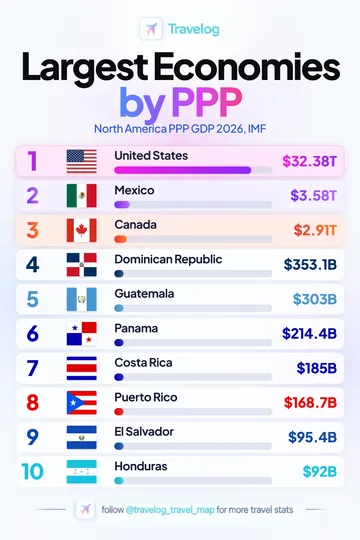
United States is listed first at $32.38T in the supplied North America, Central America and Caribbean GDP (PPP) chart.
View image and data →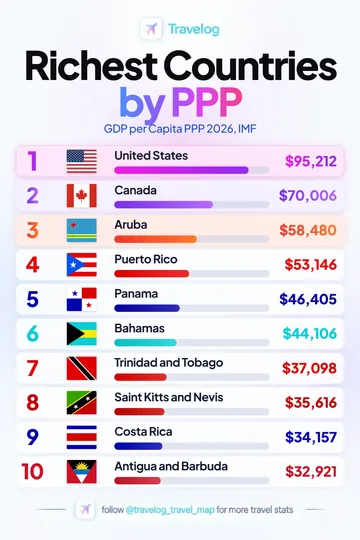
United States is listed first at $95,212 in the supplied North America, Central America and Caribbean GDP per capita (PPP) chart.
View image and data →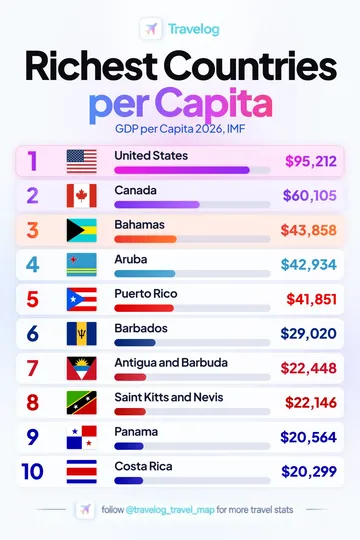
United States is listed first at $95,212 in the supplied North America, Central America and Caribbean GDP per capita chart.
View image and data →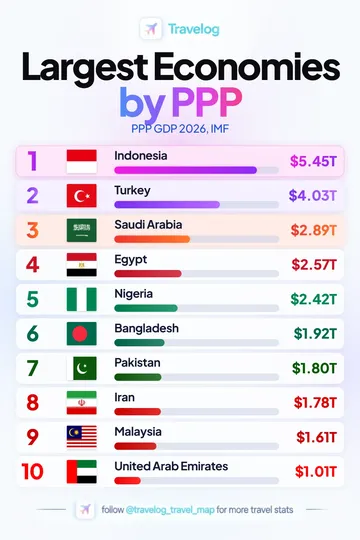
Indonesia is listed first at $5.45T in the supplied OIC major countries GDP (PPP) chart.
View image and data →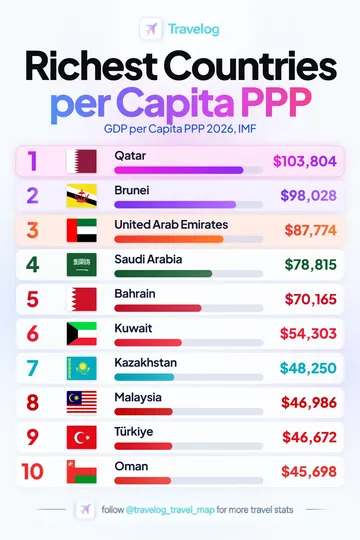
Qatar is listed first at $103,804 in the supplied OIC major countries GDP per capita (PPP) chart.
View image and data →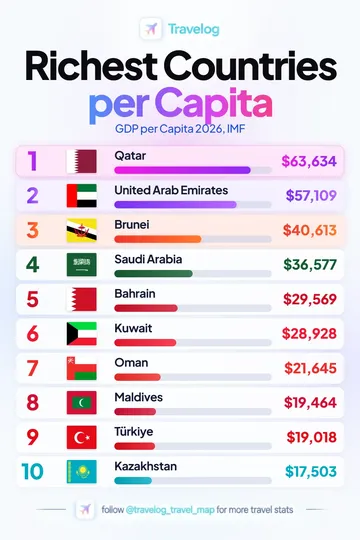
Qatar is listed first at $63,634 in the supplied OIC major countries GDP per capita chart.
View image and data →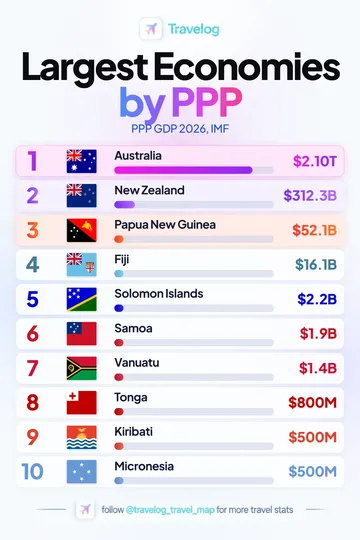
Australia is listed first at $2.10T in the supplied Oceania GDP (PPP) chart.
View image and data →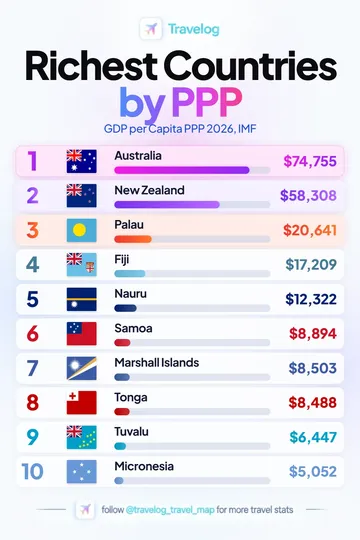
Australia is listed first at $74,755 in the supplied Oceania GDP per capita (PPP) chart.
View image and data →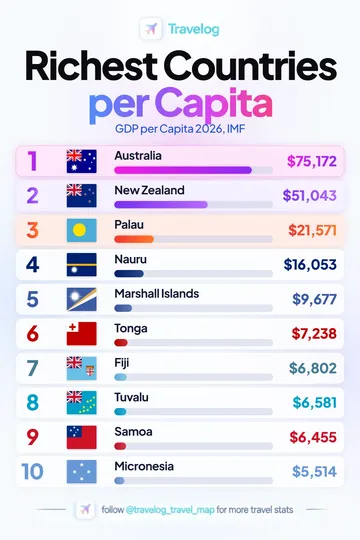
Australia is listed first at $75,172 in the supplied Oceania GDP per capita chart.
View image and data →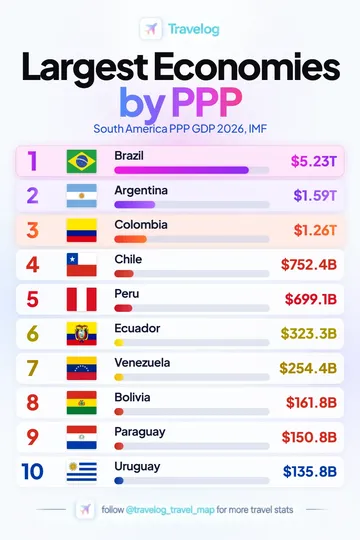
Brazil is listed first at $5.23T in the supplied South America GDP (PPP) chart.
View image and data →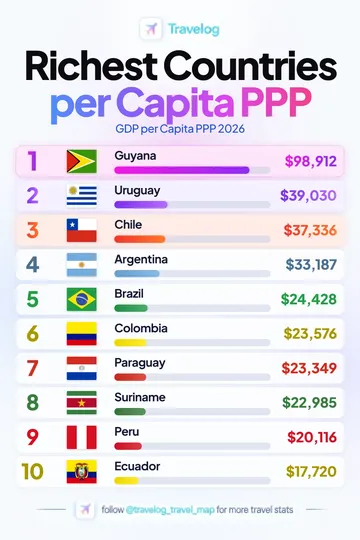
Guyana is listed first at $98,912 in the supplied South America GDP per capita (PPP) chart.
View image and data →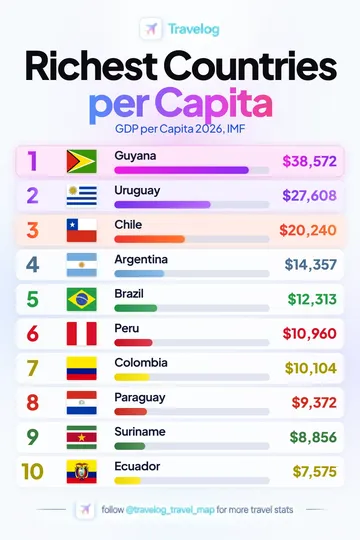
Guyana is listed first at $38,572 in the supplied South America GDP per capita chart.
View image and data →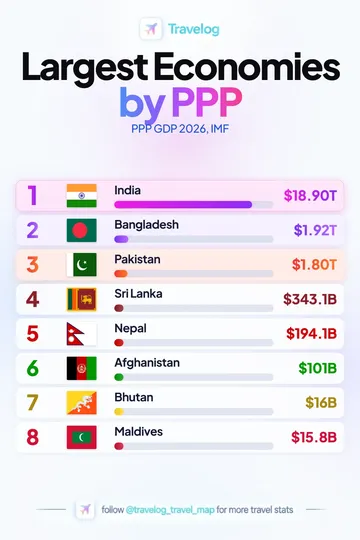
India is listed first at $18.90T in the supplied South Asia GDP (PPP) chart.
View image and data →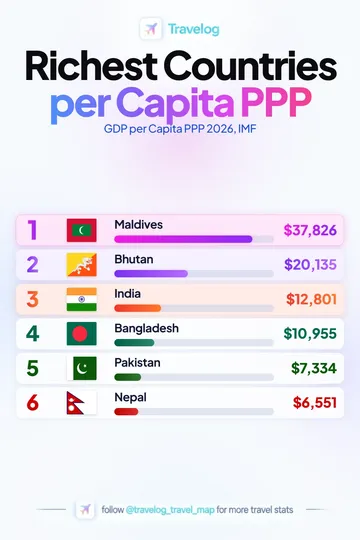
Maldives is listed first at $37,826 in the supplied South Asia GDP per capita (PPP) chart.
View image and data →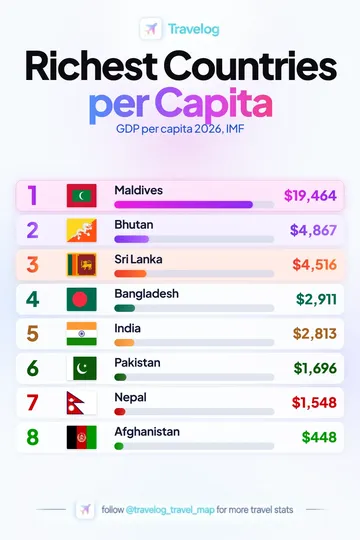
Maldives is listed first at $19,464 in the supplied South Asia GDP per capita chart.
View image and data →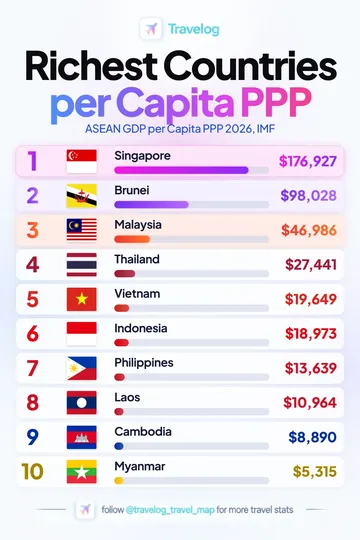
Singapore is listed first at $176,927 in the supplied Southeast Asia GDP per capita (PPP) chart.
View image and data →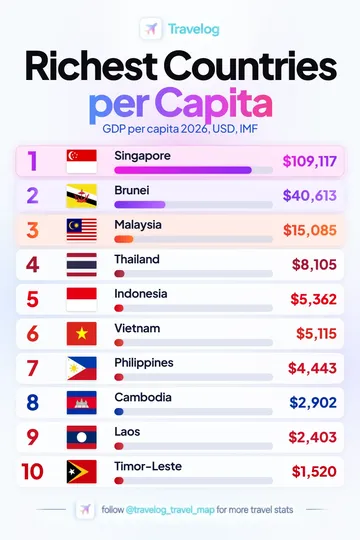
Singapore is listed first at $109,117 in the supplied Southeast Asia GDP per capita chart.
View image and data →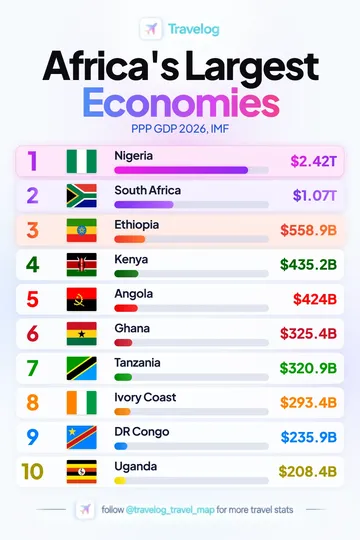
Nigeria is listed first at $2.42T in the supplied Sub-Saharan Africa GDP (PPP) chart.
View image and data →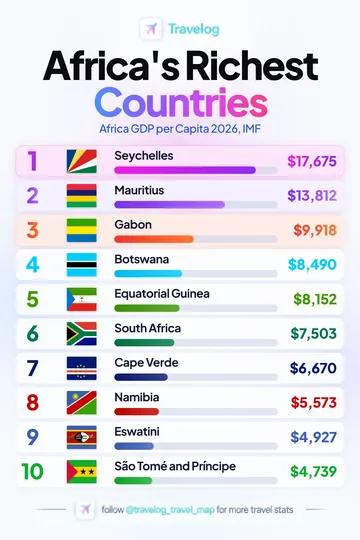
Seychelles is listed first at $17,675 in the supplied Sub-Saharan Africa GDP per capita chart.
View image and data →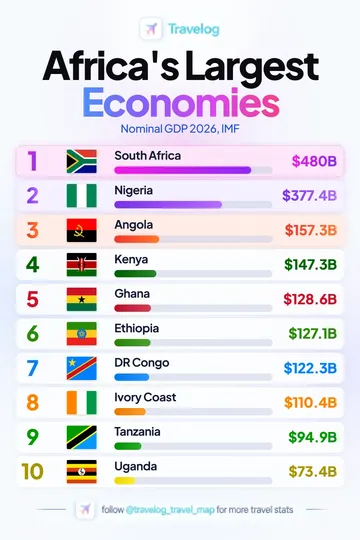
South Africa is listed first at $480B in the supplied Sub-Saharan Africa Nominal GDP chart.
View image and data →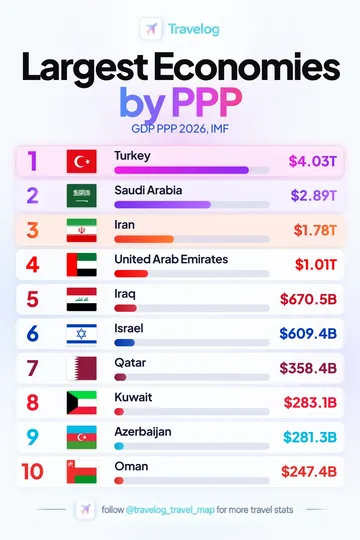
Turkey is listed first at $4.03T in the supplied West Asia and Middle East GDP (PPP) chart.
View image and data →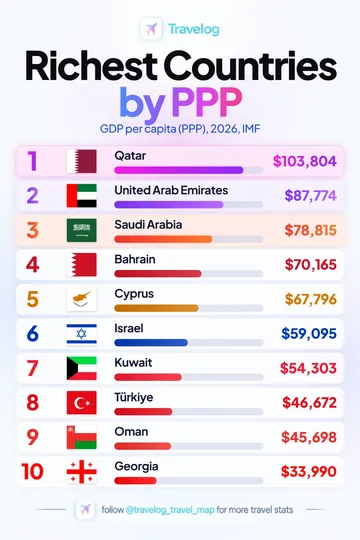
Qatar is listed first at $103,804 in the supplied West Asia and Middle East GDP per capita (PPP) chart.
View image and data →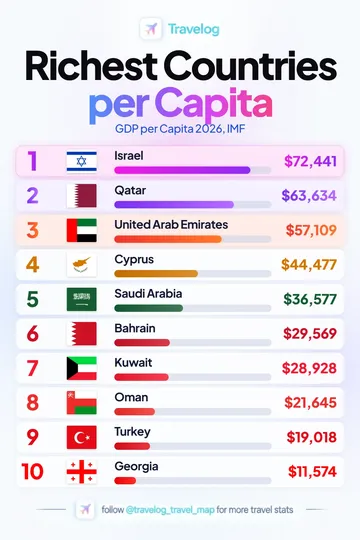
Israel is listed first at $72,441 in the supplied West Asia and Middle East GDP per capita chart.
View image and data →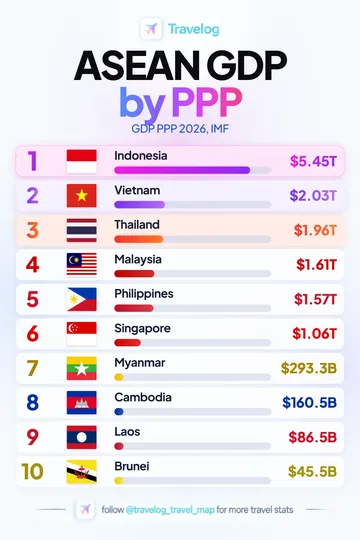
Indonesia is listed first at $5.45T in this supplied graphic. GDP PPP 2026, IMF.
View image and data →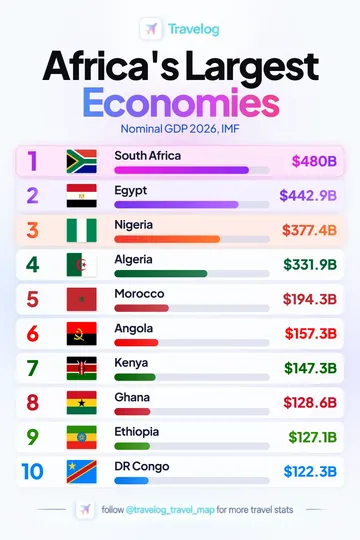
South Africa is listed first at $480B in this supplied graphic. Nominal GDP 2026, IMF.
View image and data →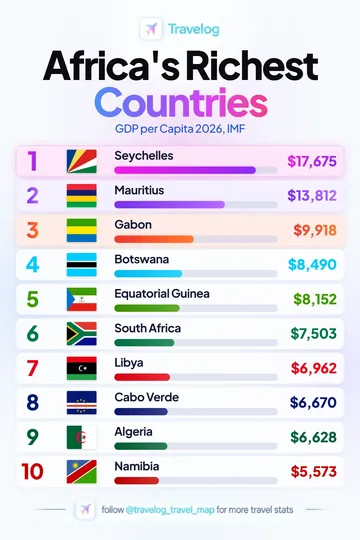
Seychelles is listed first at $17,675 in this supplied graphic. GDP per Capita 2026, IMF.
View image and data →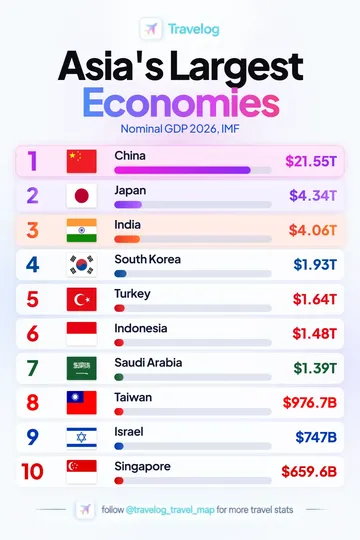
China is listed first at $21.55T in this supplied graphic. Nominal GDP 2026, IMF.
View image and data →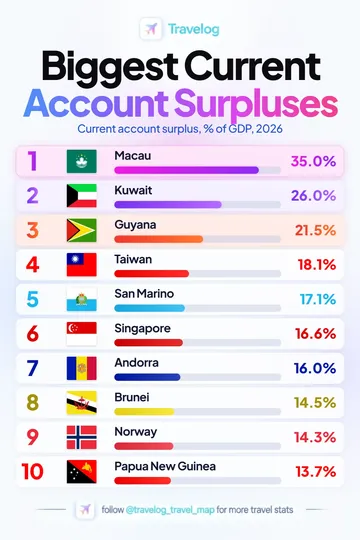
Macau is listed first at 35.0% in this supplied graphic. Current account surplus, % of GDP, 2026.
View image and data →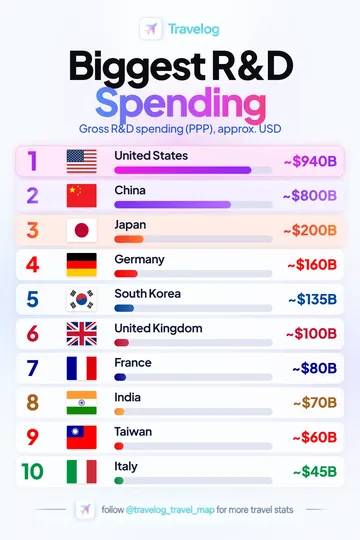
United States is listed first at ~$940B in this supplied graphic. Gross R&D spending (PPP), approx. USD.
View image and data →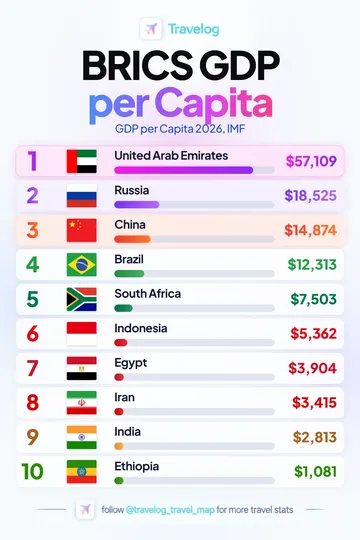
United Arab Emirates is listed first at $57,109 in this supplied graphic. GDP per Capita 2026, IMF.
View image and data →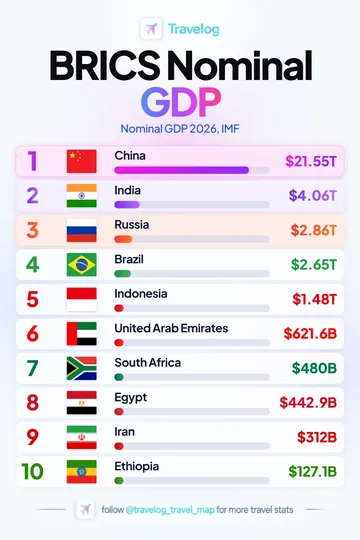
China is listed first at $21.55T in this supplied graphic. Nominal GDP 2026, IMF.
View image and data →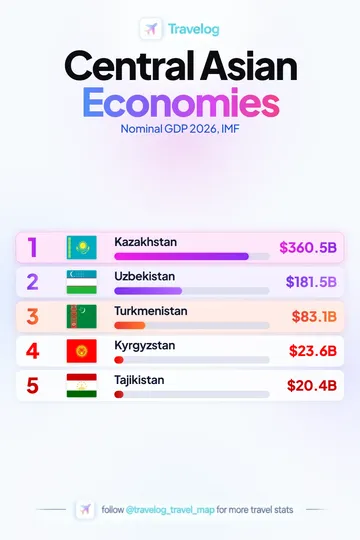
Kazakhstan is listed first at $360.5B in this supplied graphic. Nominal GDP 2026, IMF.
View image and data →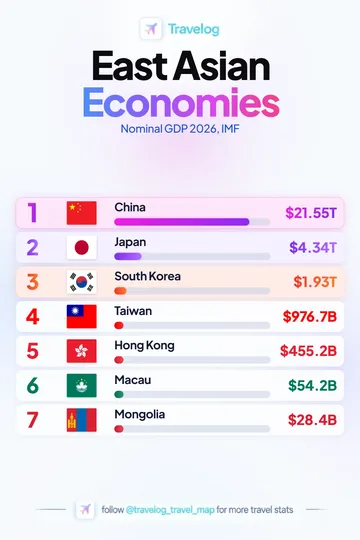
China is listed first at $21.55T in this supplied graphic. Nominal GDP 2026, IMF.
View image and data →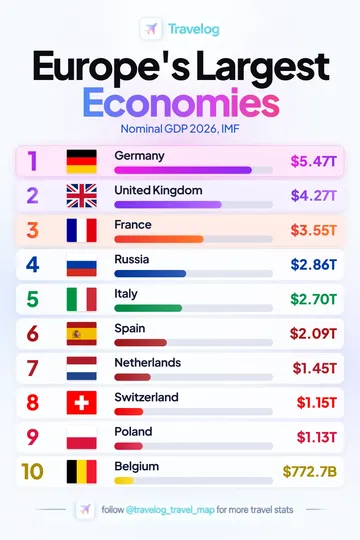
Germany is listed first at $5.47T in this supplied graphic. Nominal GDP 2026, IMF.
View image and data →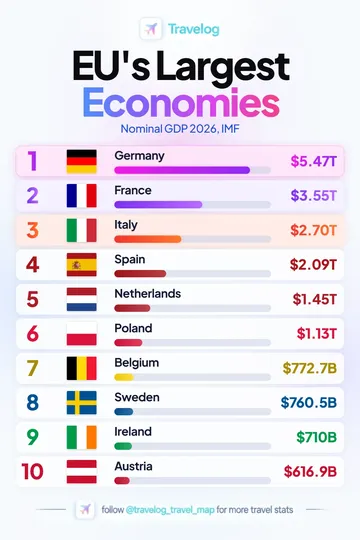
Germany is listed first at $5.47T in this supplied graphic. Nominal GDP 2026, IMF.
View image and data →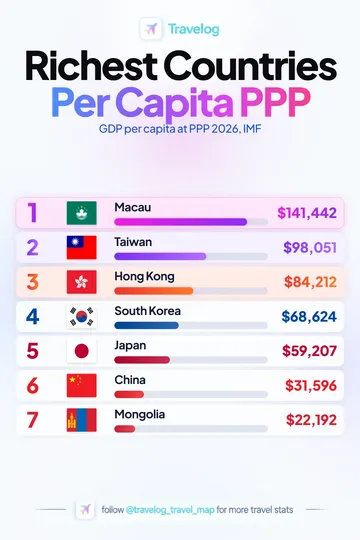
Macau is listed first at $141,442 in this supplied graphic. GDP per capita at PPP 2026, IMF.
View image and data →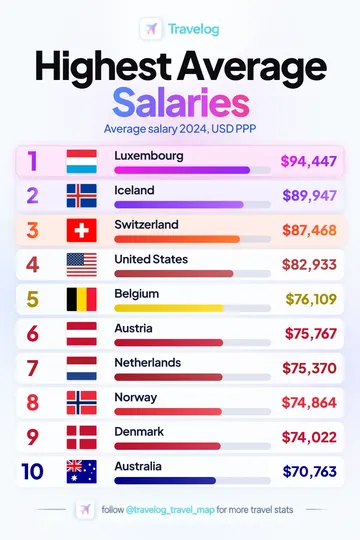
Luxembourg is listed first at $94,447 in this supplied graphic. Average salary 2024, USD PPP.
View image and data →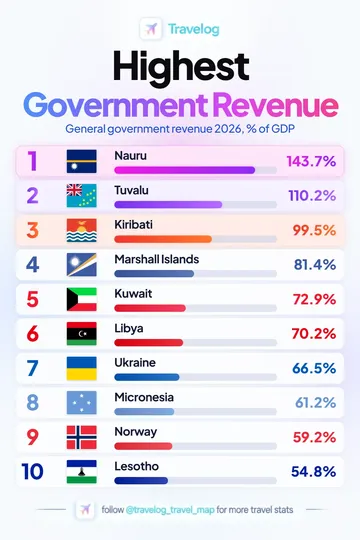
Nauru is listed first at 143.7% in this supplied graphic. General government revenue 2026, % of GDP.
View image and data →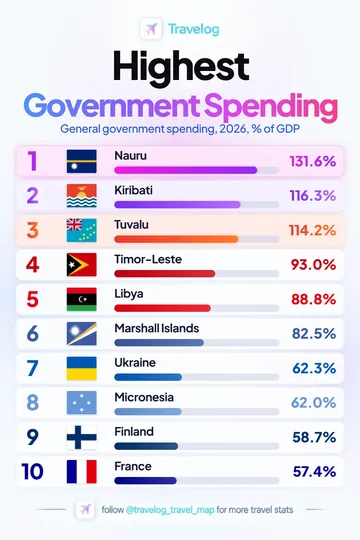
Nauru is listed first at 131.6% in this supplied graphic. General government spending, 2026, % of GDP.
View image and data →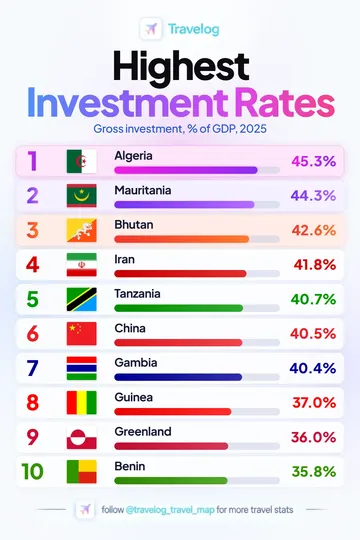
Algeria is listed first at 45.3% in this supplied graphic. Gross investment, % of GDP, 2025.
View image and data →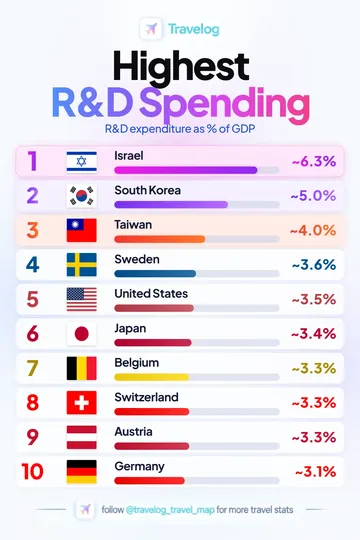
Israel is listed first at ~6.3% in this supplied graphic. R&D expenditure as % of GDP.
View image and data →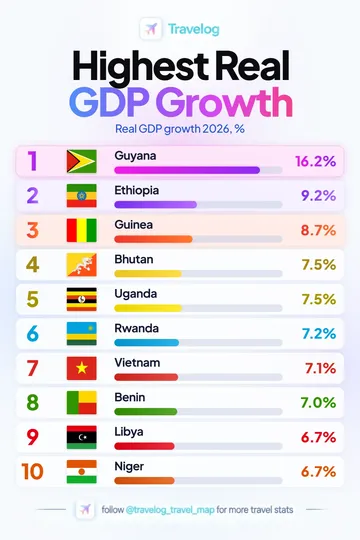
Guyana is listed first at 16.2% in this supplied graphic. Real GDP growth 2026, %.
View image and data →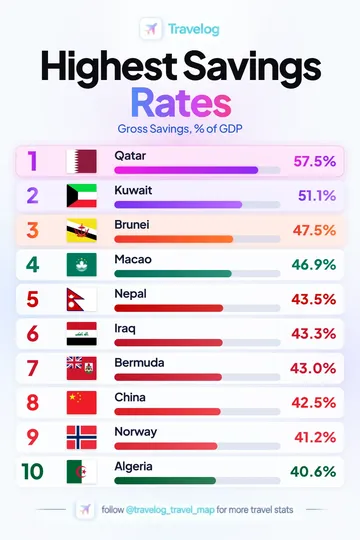
Qatar is listed first at 57.5% in this supplied graphic. Gross Savings, % of GDP.
View image and data →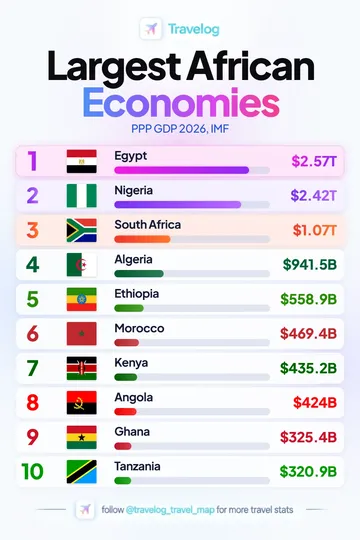
Egypt is listed first at $2.57T in this supplied graphic. PPP GDP 2026, IMF.
View image and data →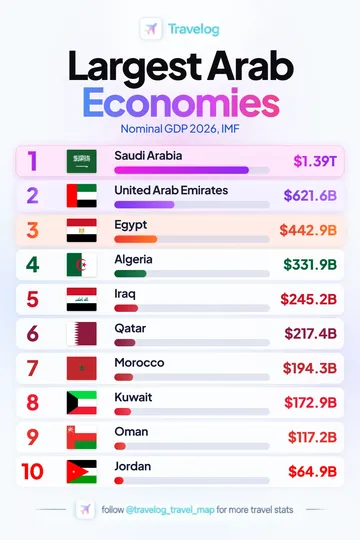
Saudi Arabia is listed first at $1.39T in this supplied graphic. Nominal GDP 2026, IMF.
View image and data →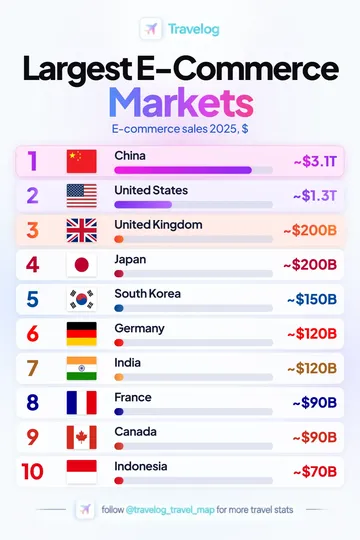
China is listed first at ~$3.1T in this supplied graphic. E-commerce sales 2025, $.
View image and data →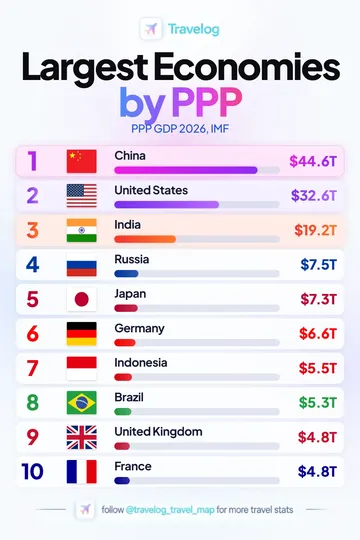
China is listed first at $44.6T in this supplied graphic. PPP GDP 2026, IMF.
View image and data →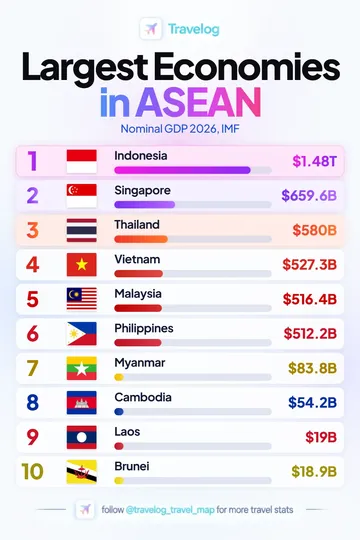
Indonesia is listed first at $1.48T in this supplied graphic. Nominal GDP 2026, IMF.
View image and data →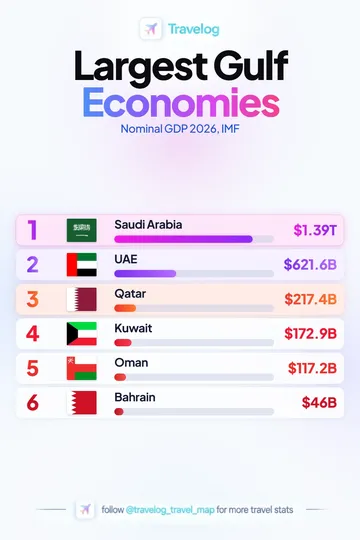
Saudi Arabia is listed first at $1.39T in this supplied graphic. Nominal GDP 2026, IMF.
View image and data →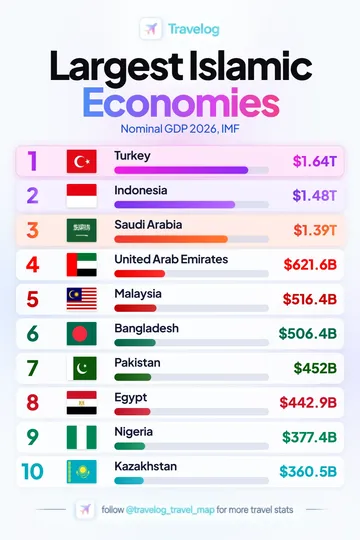
Turkey is listed first at $1.64T in this supplied graphic. Nominal GDP 2026, IMF.
View image and data →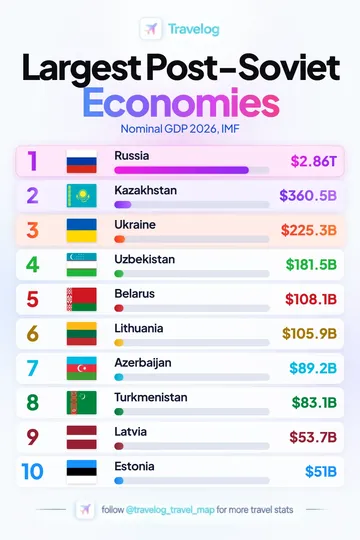
Russia is listed first at $2.86T in this supplied graphic. Nominal GDP 2026, IMF.
View image and data →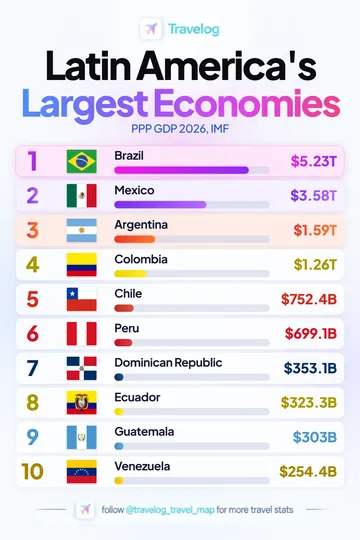
Brazil is listed first at $5.23T in this supplied graphic. PPP GDP 2026, IMF.
View image and data →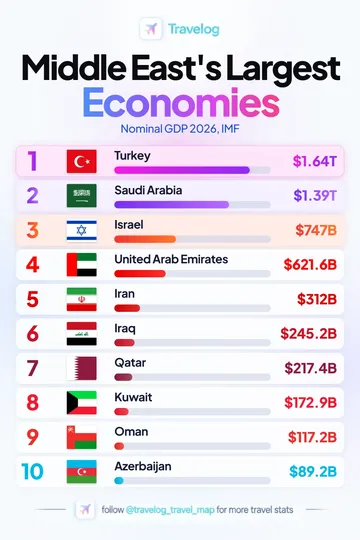
Turkey is listed first at $1.64T in this supplied graphic. Nominal GDP 2026, IMF.
View image and data →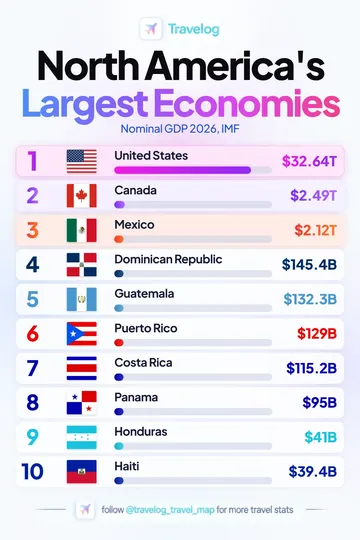
United States is listed first at $32.64T in this supplied graphic. Nominal GDP 2026, IMF.
View image and data →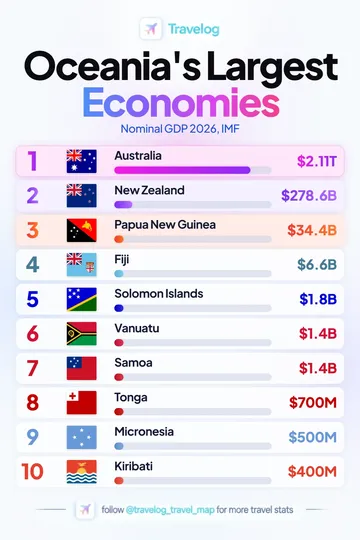
Australia is listed first at $2.11T in this supplied graphic. Nominal GDP 2026, IMF.
View image and data →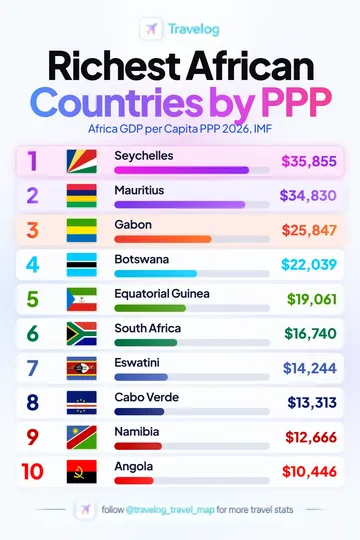
Seychelles is listed first at $35,855 in this supplied graphic. Africa GDP per Capita PPP 2026, IMF.
View image and data →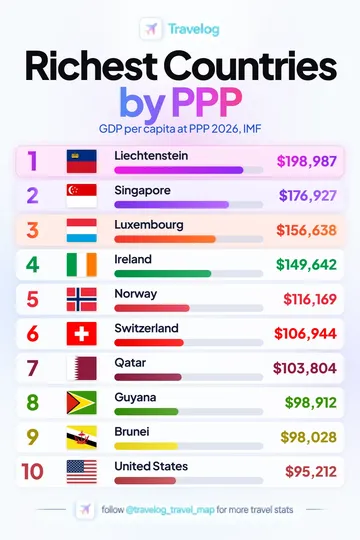
Liechtenstein is listed first at $198,987 in this supplied graphic. GDP per capita at PPP 2026, IMF.
View image and data →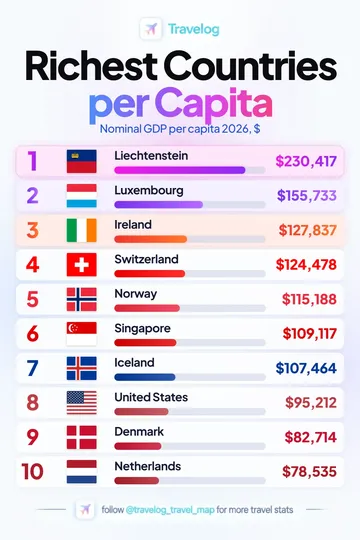
Liechtenstein is listed first at $230,417 in this supplied graphic. Nominal GDP per capita 2026, $.
View image and data →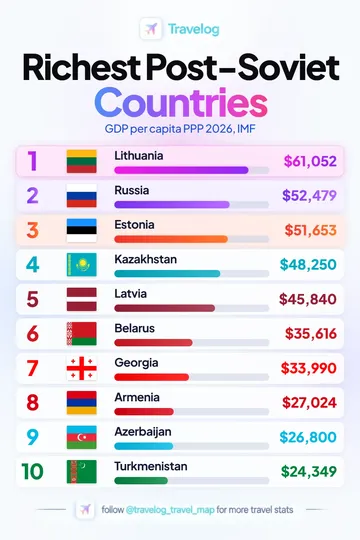
Lithuania is listed first at $61,052 in this supplied graphic. GDP per capita PPP 2026, IMF.
View image and data →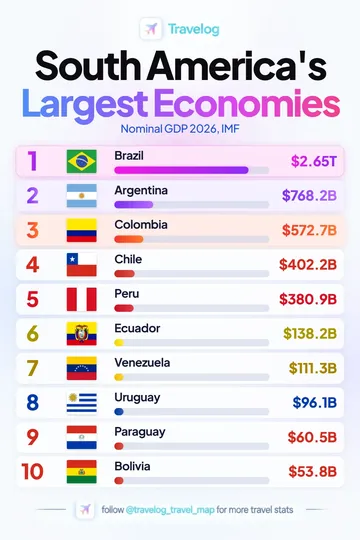
Brazil is listed first at $2.65T in this supplied graphic. Nominal GDP 2026, IMF.
View image and data →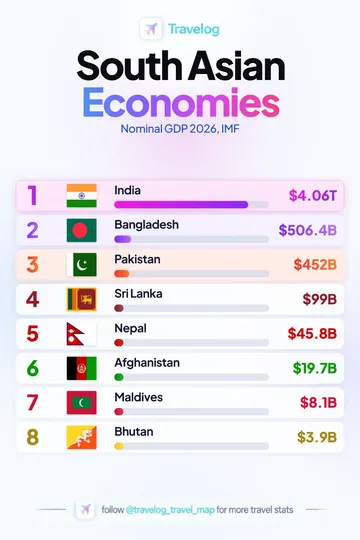
India is listed first at $4.06T in this supplied graphic. Nominal GDP 2026, IMF.
View image and data →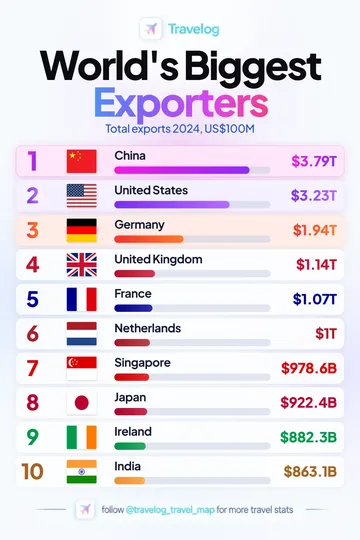
China is listed first at $3.79T in this supplied graphic. Total exports 2024, US$100M.
View image and data →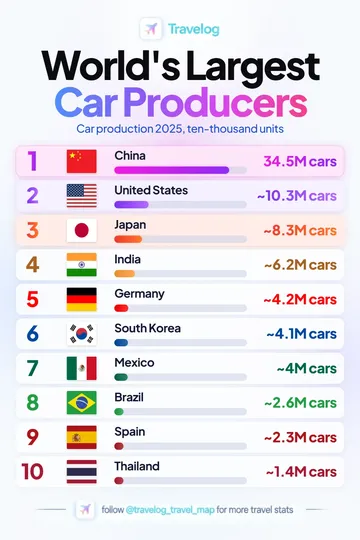
China is listed first at 34.5M cars in this supplied graphic. Car production 2025, ten-thousand units.
View image and data →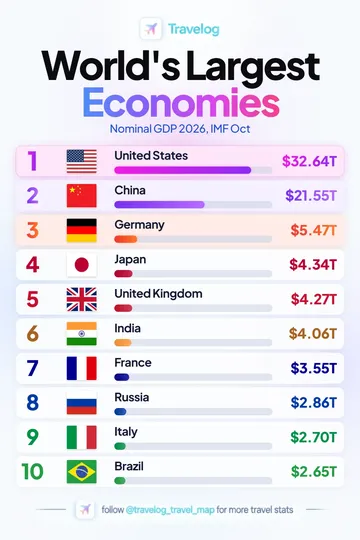
United States is listed first at $32.64T in this supplied graphic. Nominal GDP 2026, IMF Oct.
View image and data →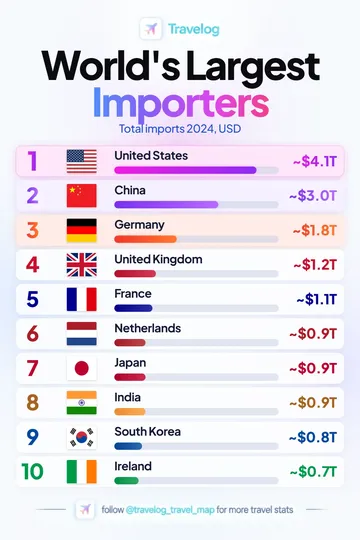
United States is listed first at ~$4.1T in this supplied graphic. Total imports 2024, USD.
View image and data →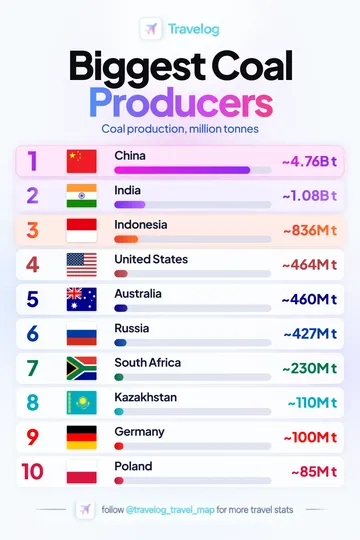
China is listed first at ~4.76Bt in this supplied graphic. Coal production, million tonnes.
View image and data →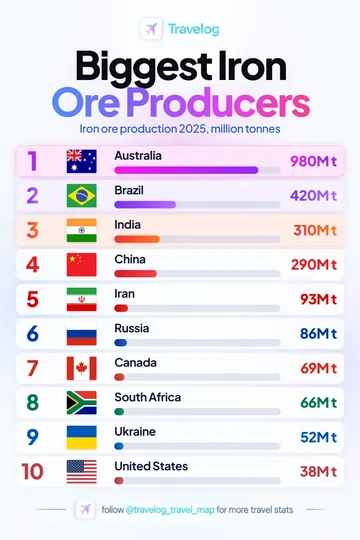
Australia is listed first at 980Mt in this supplied graphic. Iron ore production 2025, million tonnes.
View image and data →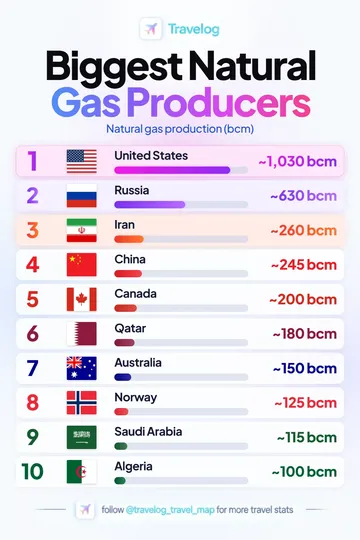
United States is listed first at ~1,030 bcm in this supplied graphic. Natural gas production (bcm).
View image and data →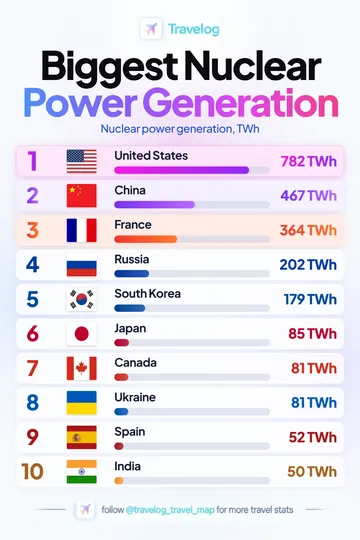
United States is listed first at 782TWh in this supplied graphic. Nuclear power generation, TWh.
View image and data →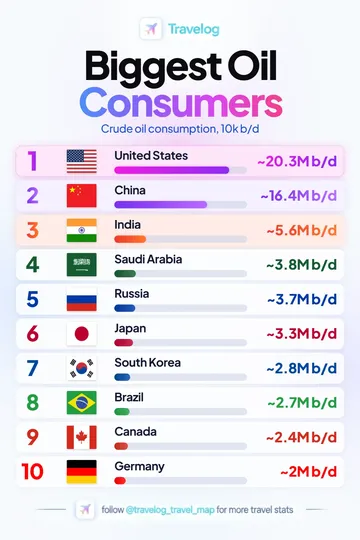
United States is listed first at ~20.3M b/d in this supplied graphic. Crude oil consumption, 10k b/d.
View image and data →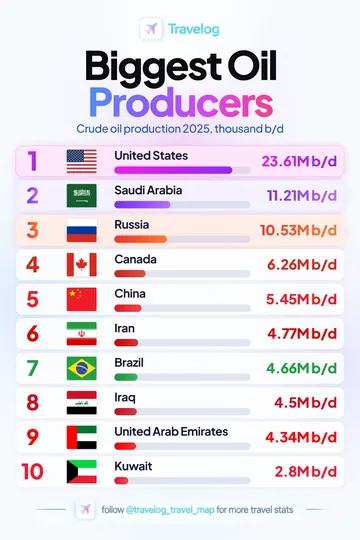
United States is listed first at 23.61M b/d in this supplied graphic. Crude oil production 2025, thousand b/d.
View image and data →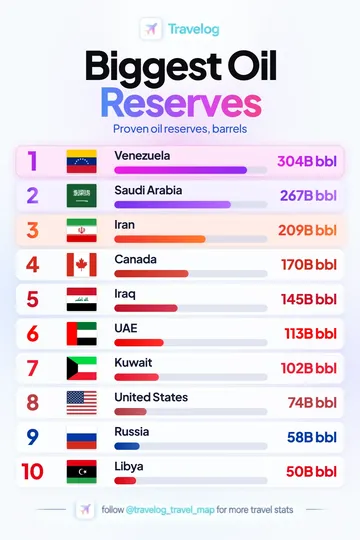
Venezuela is listed first at 304B bbl in this supplied graphic. Proven oil reserves, barrels.
View image and data →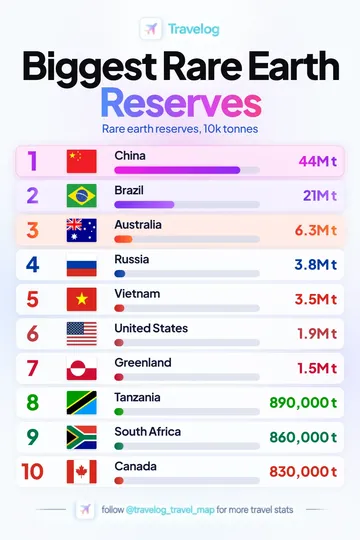
China is listed first at 44Mt in this supplied graphic. Rare earth reserves, 10k tonnes.
View image and data →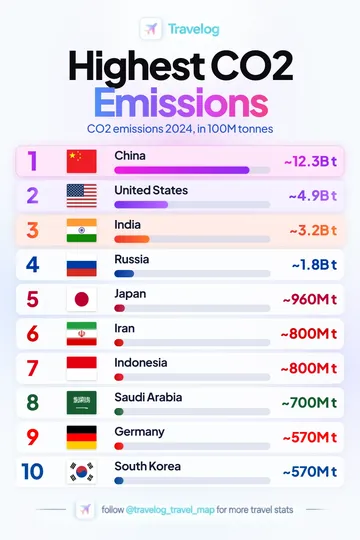
China is listed first at ~12.3Bt in this supplied graphic. CO2 emissions 2024, in 100M tonnes.
View image and data →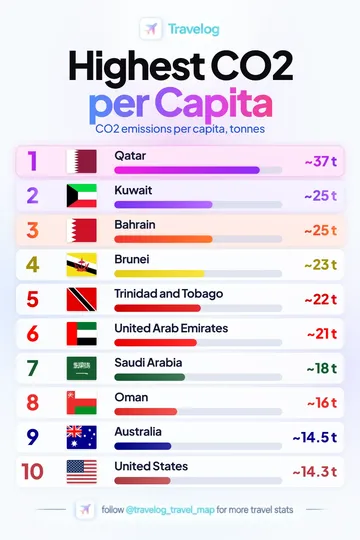
Qatar is listed first at ~37 t in this supplied graphic. CO2 emissions per capita, tonnes.
View image and data →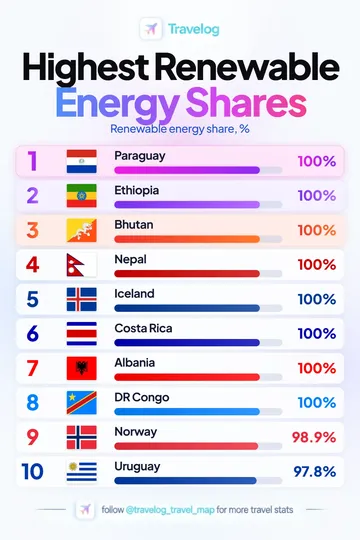
Paraguay is listed first at 100% in this supplied graphic. Renewable energy share, %.
View image and data →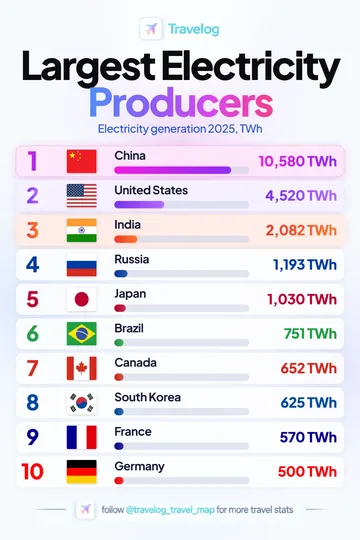
China is listed first at 10,580TWh in this supplied graphic. Electricity generation 2025, TWh.
View image and data →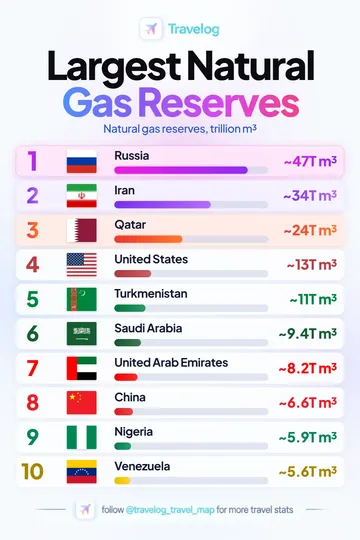
Russia is listed first at ~47T m³ in this supplied graphic. Natural gas reserves, trillion m³.
View image and data →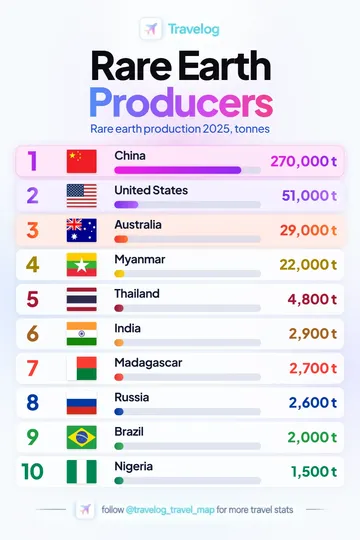
China is listed first at 270,000t in this supplied graphic. Rare earth production 2025, tonnes.
View image and data →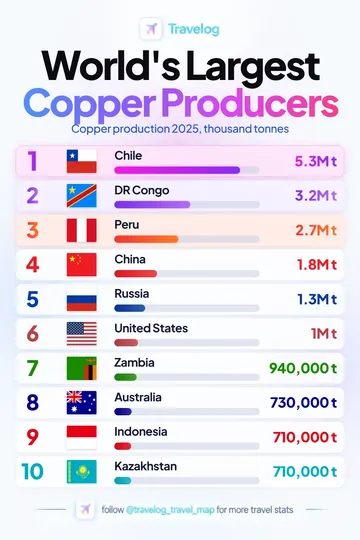
Chile is listed first at 5.3Mt in this supplied graphic. Copper production 2025, thousand tonnes.
View image and data →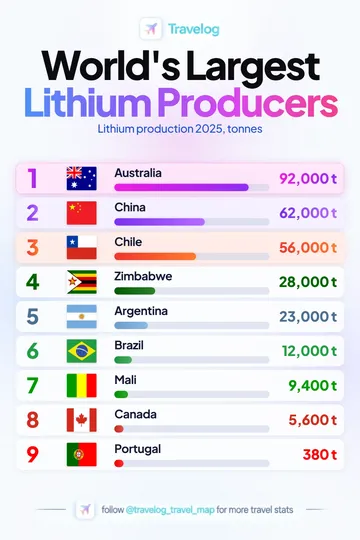
Australia is listed first at 92,000t in this supplied graphic. Lithium production 2025, tonnes.
View image and data →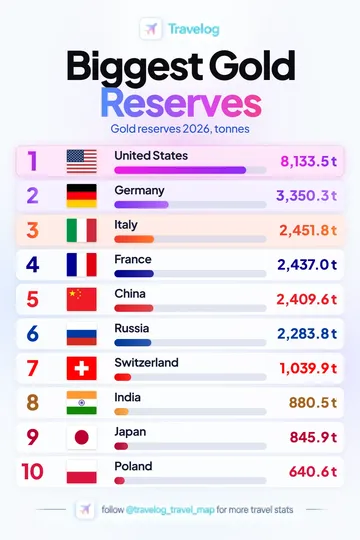
United States is listed first at 8,133.5 t in this supplied graphic. Gold reserves 2026, tonnes.
View image and data →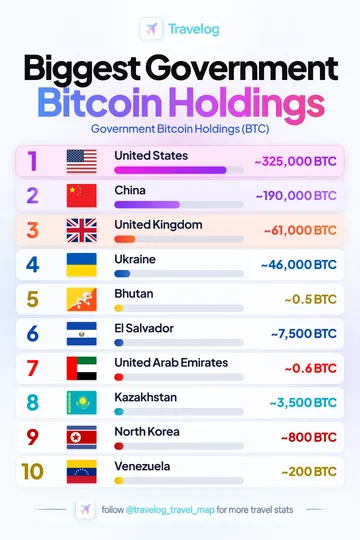
United States is listed first at ~325,000 BTC in this supplied graphic. Government Bitcoin Holdings (BTC).
View image and data →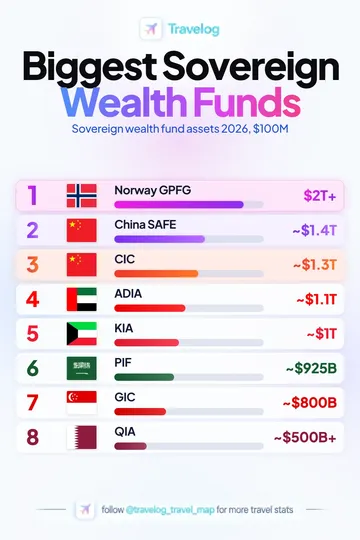
Norway GPFG is listed first at $2T+ in this supplied graphic. Sovereign wealth fund assets 2026, $100M.
View image and data →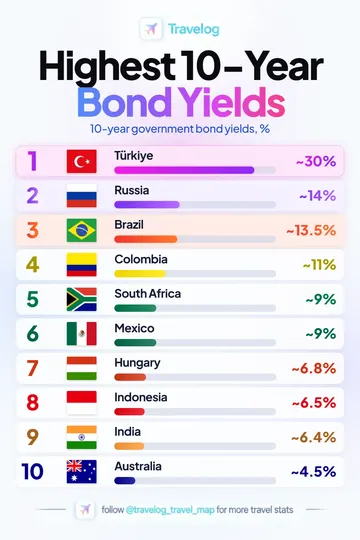
Türkiye is listed first at ~30% in this supplied graphic. 10-year government bond yields, %.
View image and data →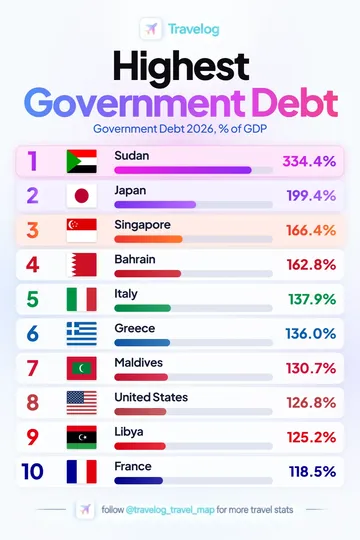
Sudan is listed first at 334.4% in this supplied graphic. Government Debt 2026, % of GDP.
View image and data →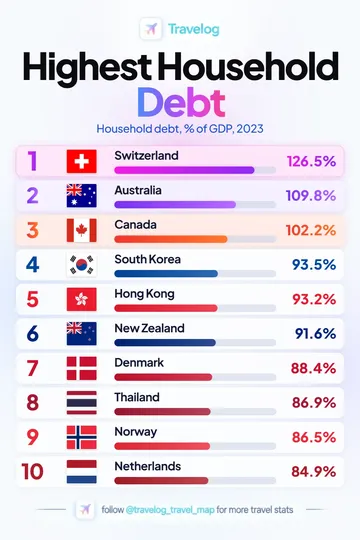
Switzerland is listed first at 126.5% in this supplied graphic. Household debt, % of GDP, 2023.
View image and data →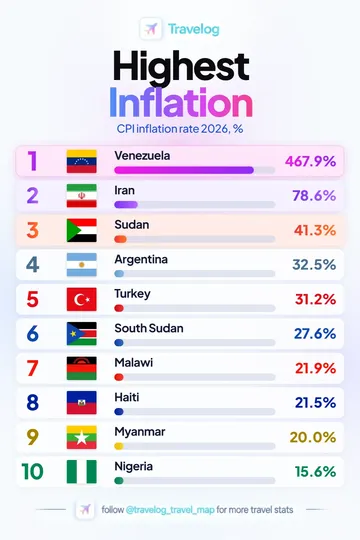
Venezuela is listed first at 467.9% in this supplied graphic. CPI inflation rate 2026, %.
View image and data →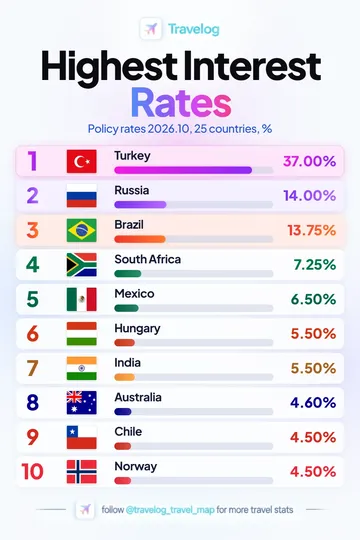
Turkey is listed first at 37.00% in this supplied graphic. Policy rates 2026.10, 25 countries, %.
View image and data →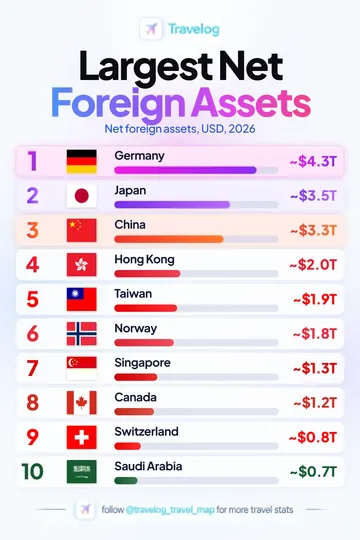
Germany is listed first at ~$4.3T in this supplied graphic. Net foreign assets, USD, 2026.
View image and data →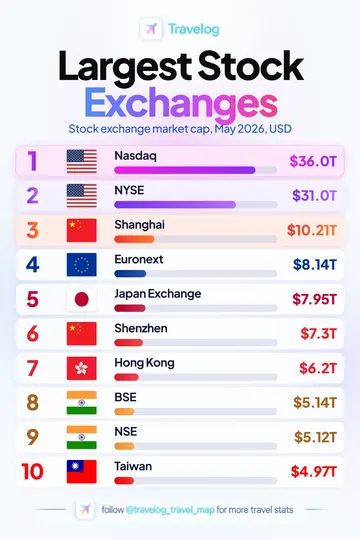
Nasdaq is listed first at $36.0T in this supplied graphic. Stock exchange market cap, May 2026, USD.
View image and data →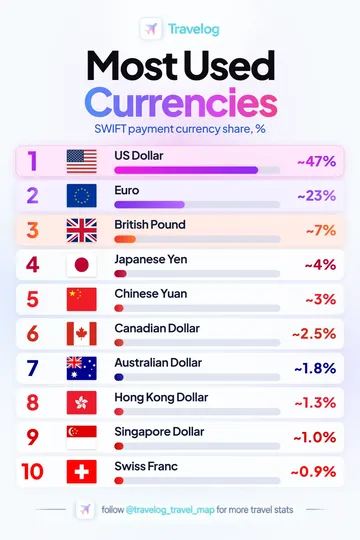
US Dollar is listed first at ~47% in this supplied graphic. SWIFT payment currency share, %.
View image and data →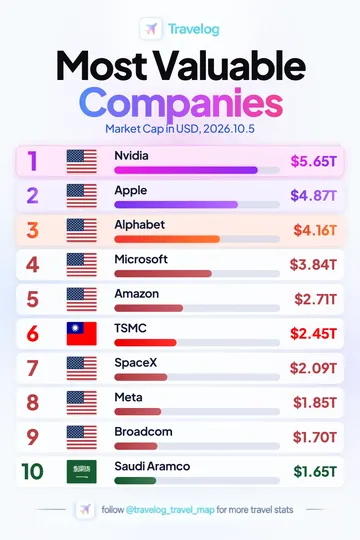
Nvidia is listed first at $5.65T in this supplied graphic. Market Cap in USD, 2026.10.5.
View image and data →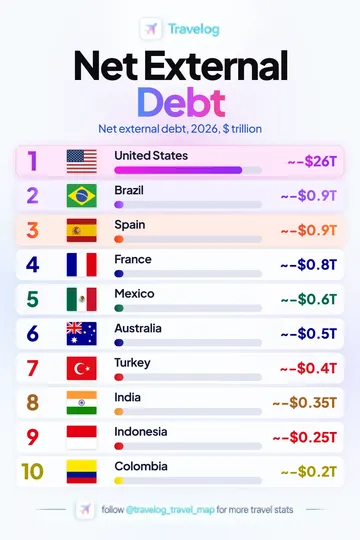
United States is listed first at ~−$26T in this supplied graphic. Net external debt, 2026, $ trillion.
View image and data →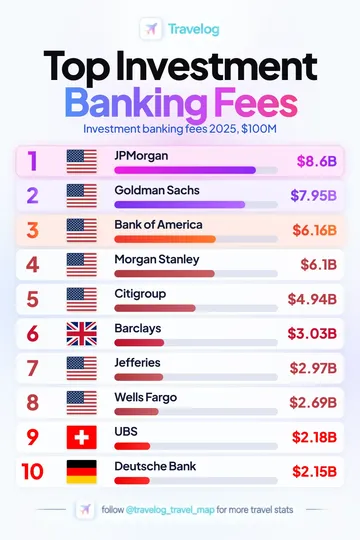
JPMorgan is listed first at $8.6B in this supplied graphic. Investment banking fees 2025, $100M.
View image and data →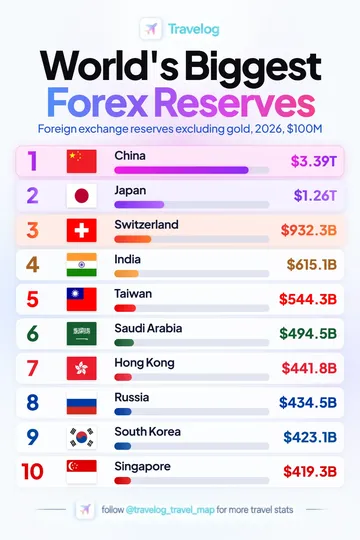
China is listed first at $3.39T in this supplied graphic. Foreign exchange reserves excluding gold, 2026, $100M.
View image and data →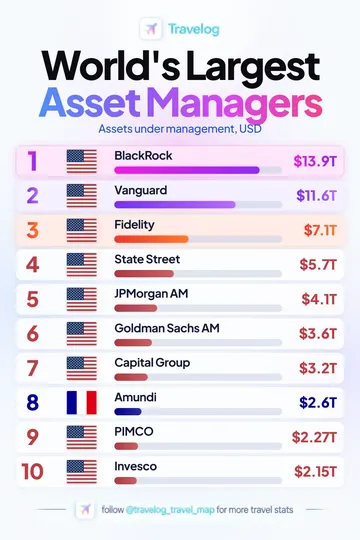
BlackRock is listed first at $13.9T in this supplied graphic. Assets under management, USD.
View image and data →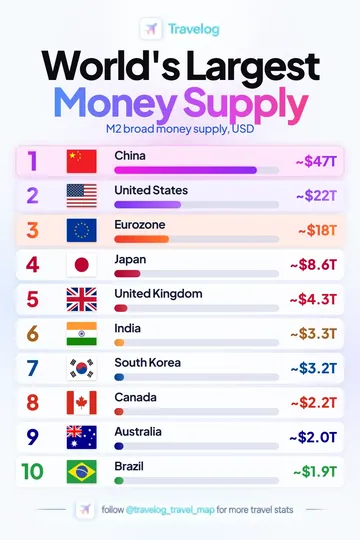
China is listed first at ~$47T in this supplied graphic. M2 broad money supply, USD.
View image and data →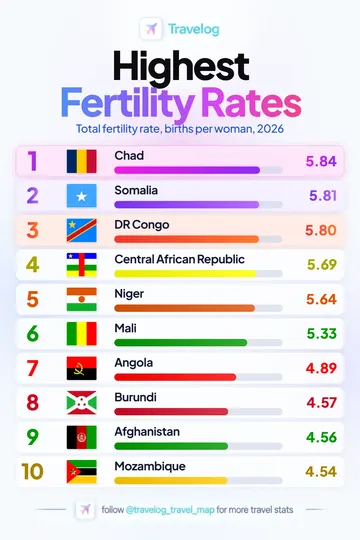
Chad is listed first at 5.84 in this supplied graphic. Total fertility rate, births per woman, 2026.
View image and data →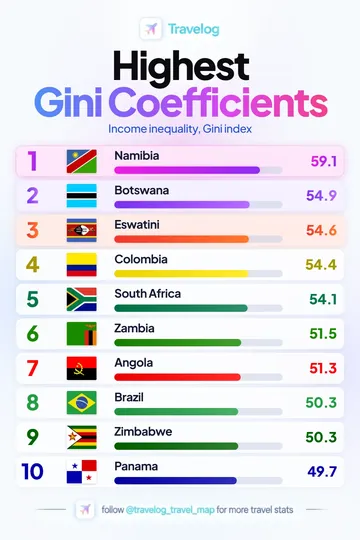
Namibia is listed first at 59.1 in this supplied graphic. Income inequality, Gini index.
View image and data →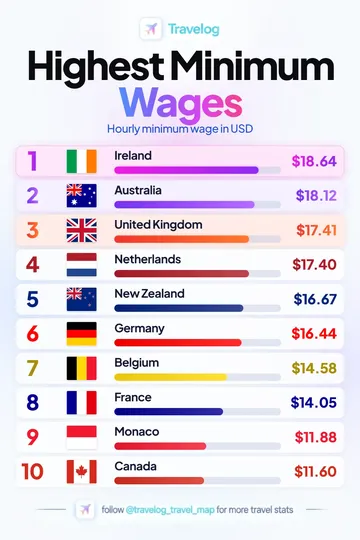
Ireland is listed first at $18.64 in this supplied graphic. Hourly minimum wage in USD.
View image and data →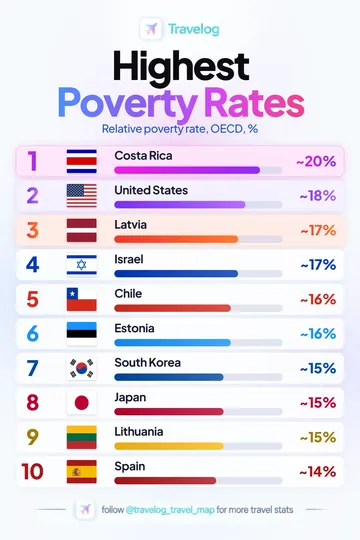
Costa Rica is listed first at ~20% in this supplied graphic. Relative poverty rate, OECD, %.
View image and data →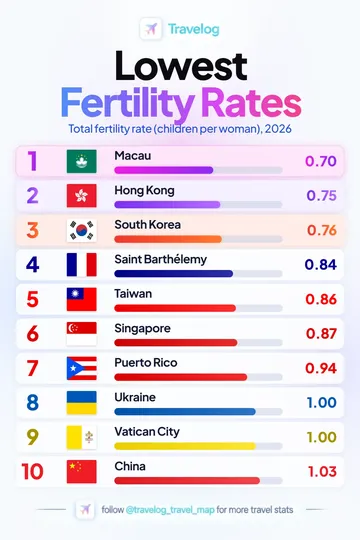
Macau is listed first at 0.70 in this supplied graphic. Total fertility rate (children per woman), 2026.
View image and data →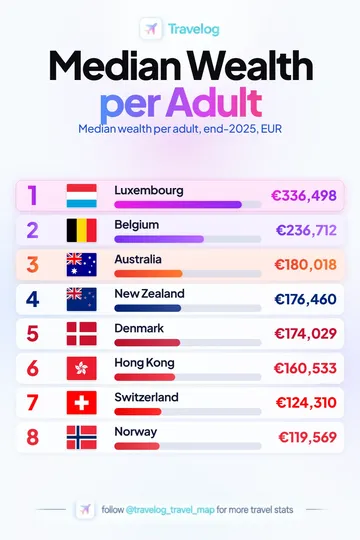
Luxembourg is listed first at €336,498 in this supplied graphic. Median wealth per adult, end-2025, EUR.
View image and data →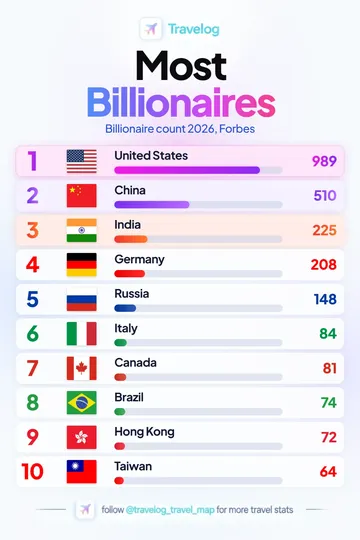
United States is listed first at 989 in this supplied graphic. Billionaire count 2026, Forbes.
View image and data →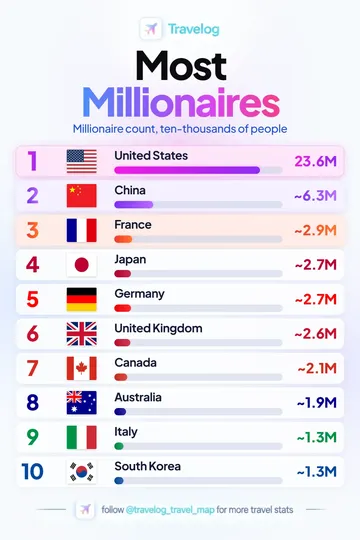
United States is listed first at 23.6M in this supplied graphic. Millionaire count, ten-thousands of people.
View image and data →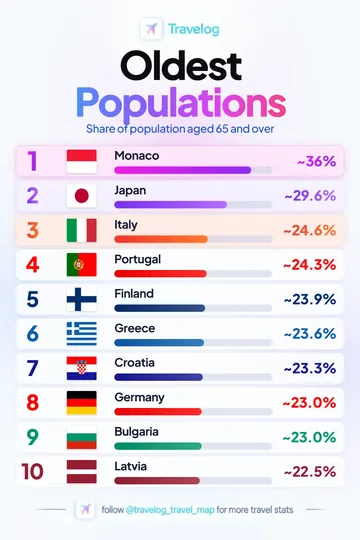
Monaco is listed first at ~36% in this supplied graphic. Share of population aged 65 and over.
View image and data →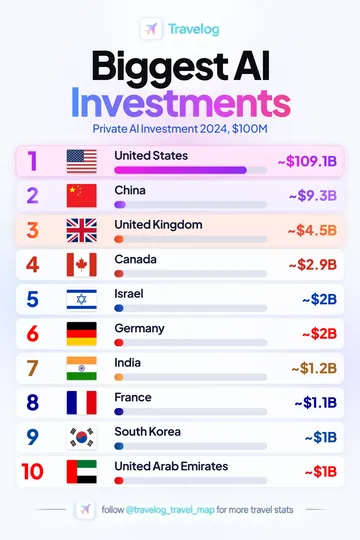
United States is listed first at ~$109.1B in this supplied graphic. Private AI Investment 2024, $100M.
View image and data →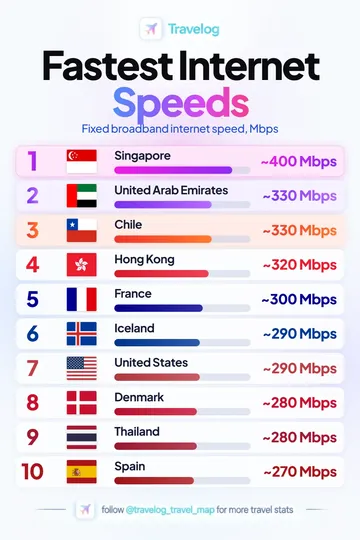
Singapore is listed first at ~400 Mbps in this supplied graphic. Fixed broadband internet speed, Mbps.
View image and data →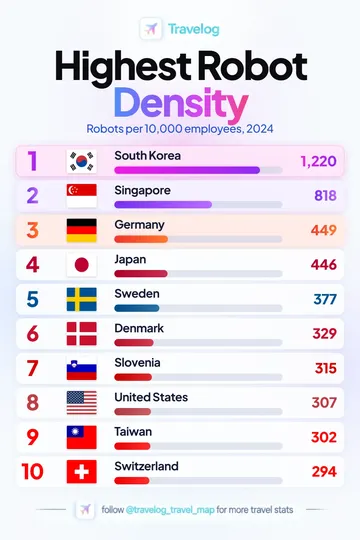
South Korea is listed first at 1,220 in this supplied graphic. Robots per 10,000 employees, 2024.
View image and data →
Nvidia is listed first at $125.7B in this supplied graphic. Semiconductor revenue 2025, $100M.
View image and data →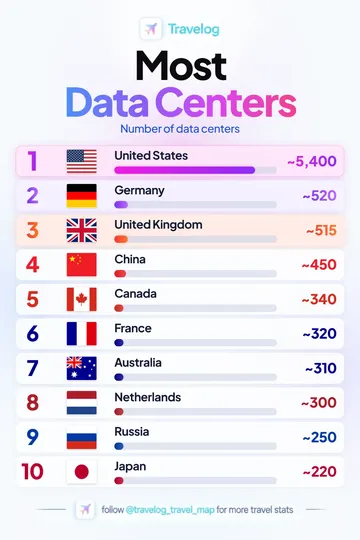
United States is listed first at ~5,400 in this supplied graphic. Number of data centers.
View image and data →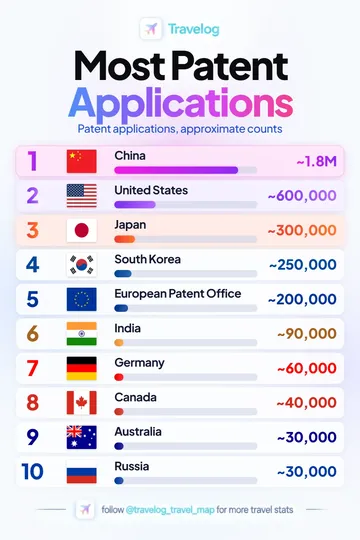
China is listed first at ~1.8M in this supplied graphic. Patent applications, approximate counts.
View image and data →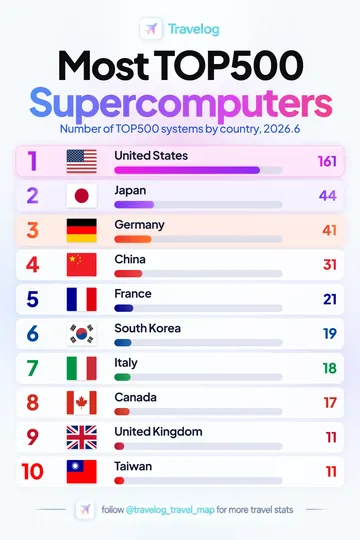
United States is listed first at 161 in this supplied graphic. Number of TOP500 systems by country, 2026.6.
View image and data →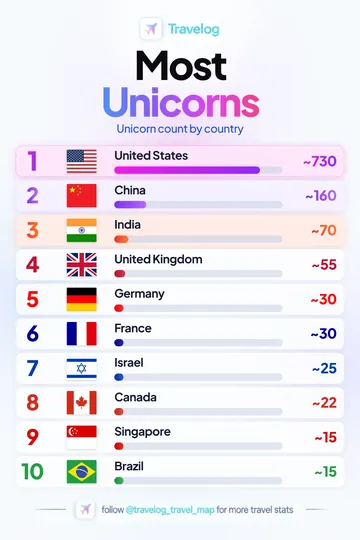
United States is listed first at ~730 in this supplied graphic. Unicorn count by country.
View image and data →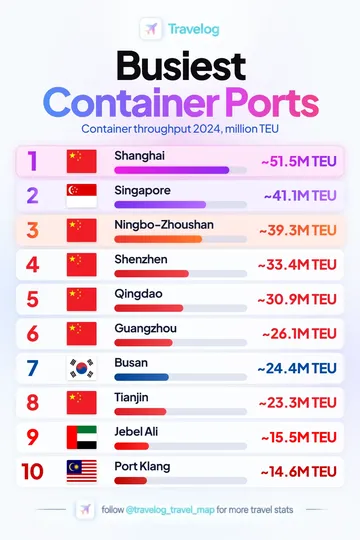
Shanghai is listed first at ~51.5M TEU in this supplied graphic. Container throughput 2024, million TEU.
View image and data →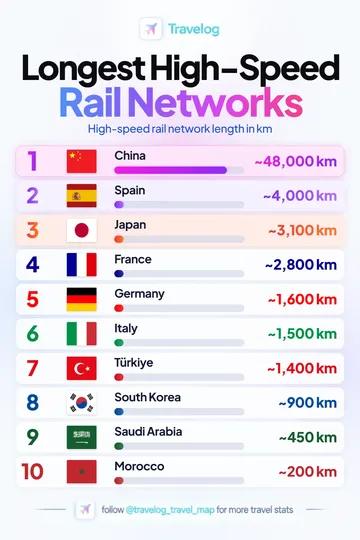
China is listed first at ~48,000km in this supplied graphic. High-speed rail network length in km.
View image and data →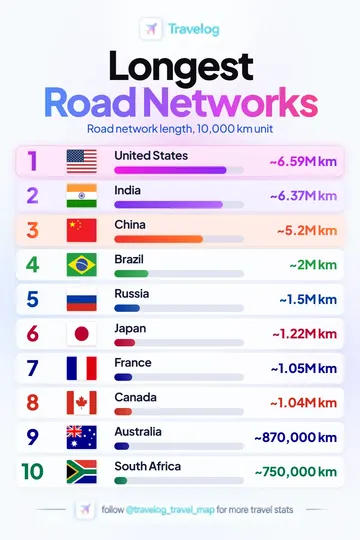
United States is listed first at ~6.59Mkm in this supplied graphic. Road network length, 10,000 km unit.
View image and data →
China is listed first at ~65% in this supplied graphic. Order share by country, 2025, %.
View image and data →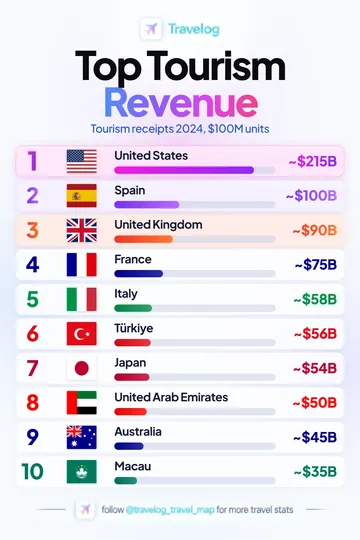
United States is listed first at ~$215B in this supplied graphic. Tourism receipts 2024, $100M units.
View image and data →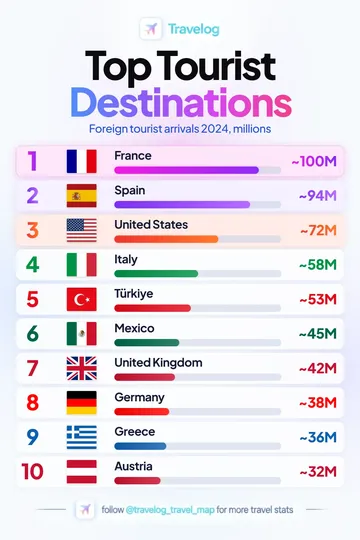
France is listed first at ~100M in this supplied graphic. Foreign tourist arrivals 2024, millions.
View image and data →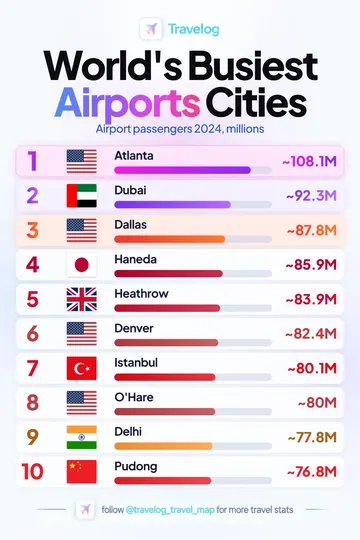
Atlanta is listed first at ~108.1M in this supplied graphic. Airport passengers 2024, millions.
View image and data →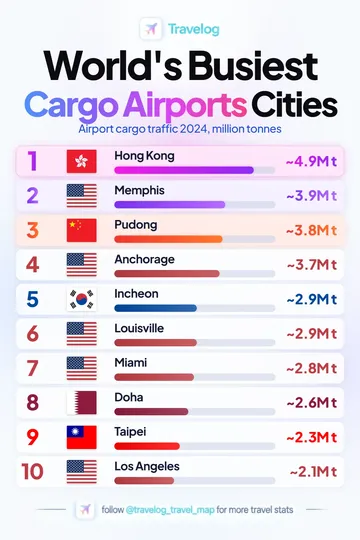
Hong Kong is listed first at ~4.9Mt in this supplied graphic. Airport cargo traffic 2024, million tonnes.
View image and data →No matching statistics. Try another place or topic.
Available for iOS and Android.