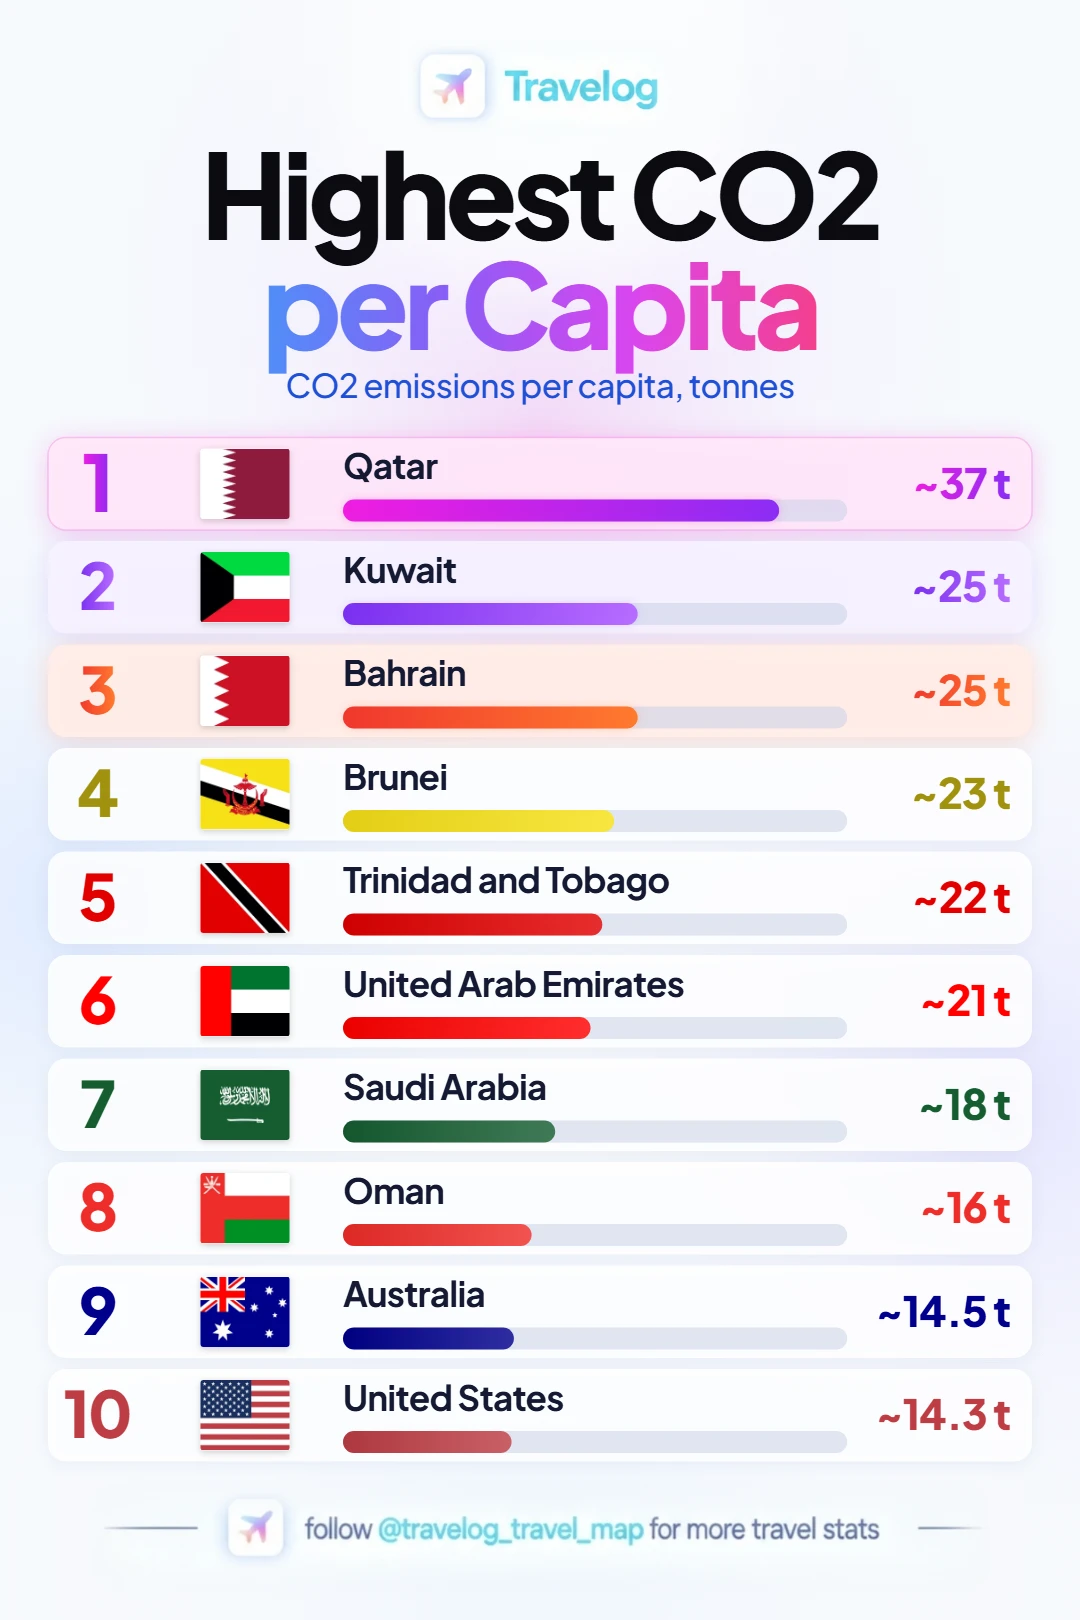
Ranking and values
Values in the units stated by the source graphic.
Highest CO₂ Per Capita| # | Country or territory | Reported value |
|---|
| 1 | Qatar | ~37 t |
|---|
| 2 | Kuwait | ~25 t |
|---|
| 3 | Bahrain | ~25 t |
|---|
| 4 | Brunei | ~23 t |
|---|
| 5 | Trinidad and Tobago | ~22 t |
|---|
| 6 | United Arab Emirates | ~21 t |
|---|
| 7 | Saudi Arabia | ~18 t |
|---|
| 8 | Oman | ~16 t |
|---|
| 9 | Australia | ~14.5 t |
|---|
| 10 | United States | ~14.3 t |
|---|
 Travelog