World data
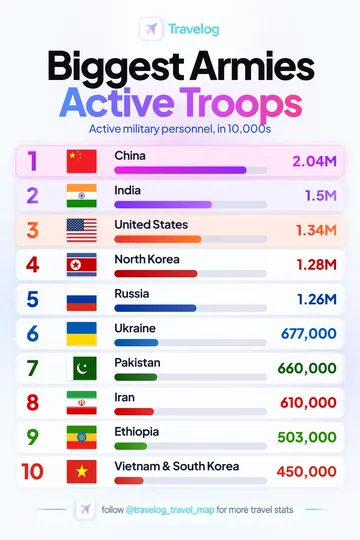
Biggest Armies Active Troops
China is listed first at 2.04M in this supplied graphic. Active military personnel, in 10,000s.
View image and data → Travelog
TRAVELOG STATISTICS LIBRARY
161 collections with original graphics, readable tables and downloadable data.
Regional and thematic collections are kept separately. Two near-duplicate world charts are excluded. Each collection states its own scope and units. About the data
161 collections
China is listed first at 2.04M in this supplied graphic. Active military personnel, in 10,000s.
View image and data →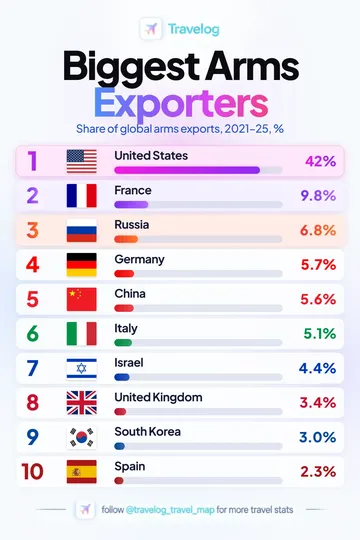
United States is listed first at 42% in this supplied graphic. Share of global arms exports, 2021–25, %.
View image and data →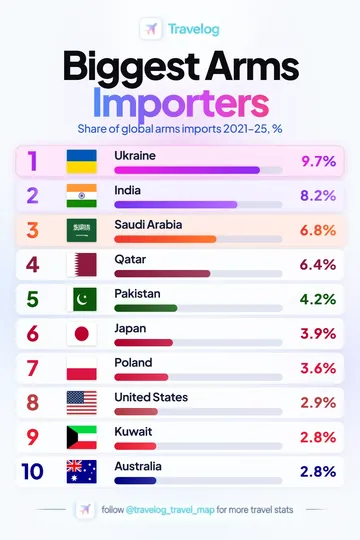
Ukraine is listed first at 9.7% in this supplied graphic. Share of global arms imports 2021–25, %.
View image and data →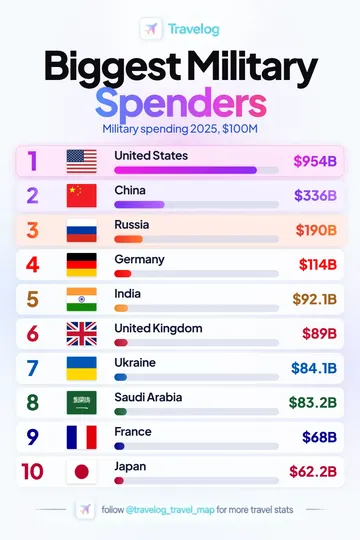
United States is listed first at $954B in this supplied graphic. Military spending 2025, $100M.
View image and data →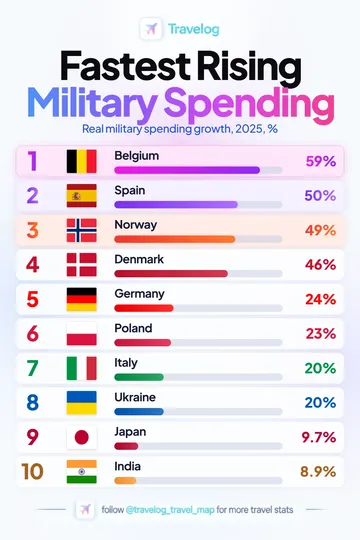
Belgium is listed first at 59% in this supplied graphic. Real military spending growth, 2025, %.
View image and data →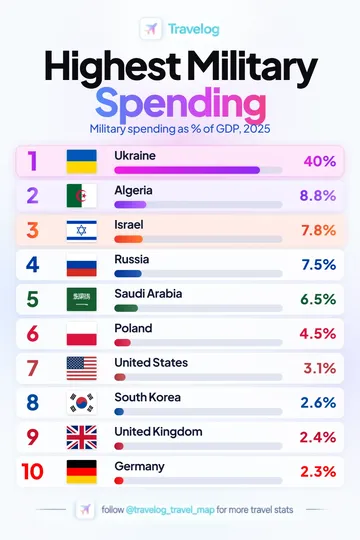
Ukraine is listed first at 40% in this supplied graphic. Military spending as % of GDP, 2025.
View image and data →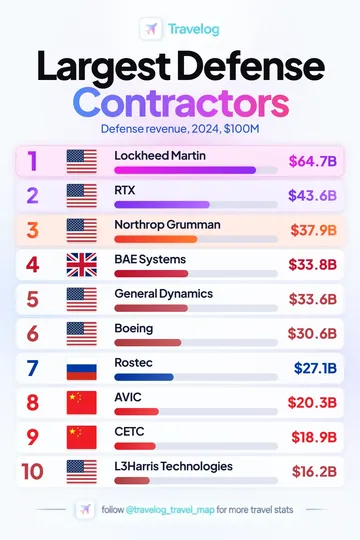
Lockheed Martin is listed first at $64.7B in this supplied graphic. Defense revenue, 2024, $100M.
View image and data →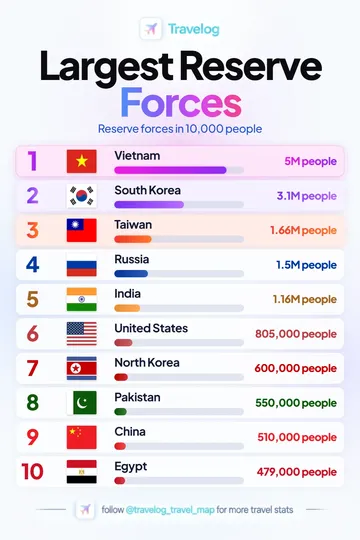
Vietnam is listed first at 5M people in this supplied graphic. Reserve forces in 10,000 people.
View image and data →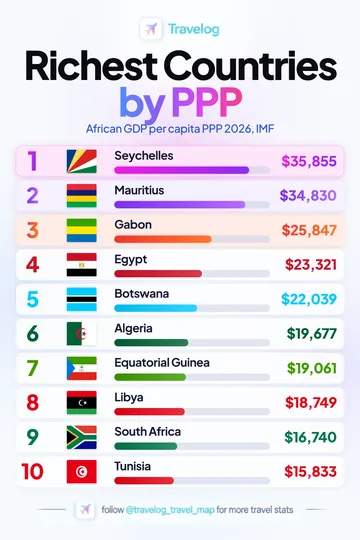
Seychelles is listed first at $35,855 in the supplied Africa GDP per capita (PPP) chart.
View image and data →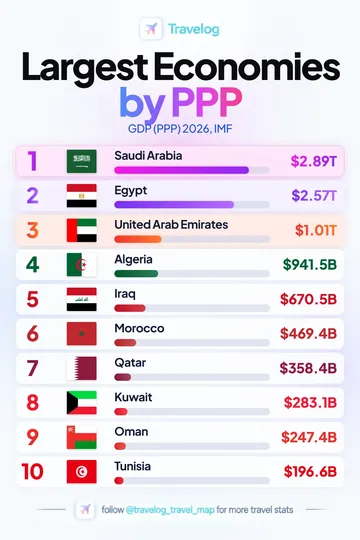
Saudi Arabia is listed first at $2.89T in the supplied Arab League GDP (PPP) chart.
View image and data →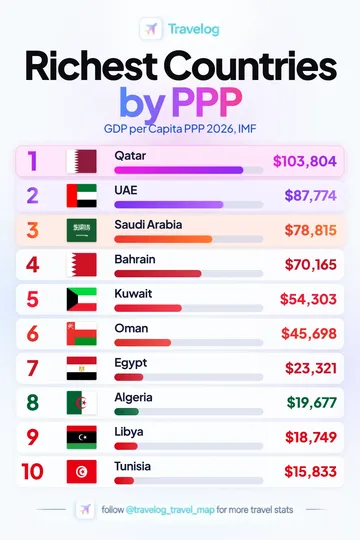
Qatar is listed first at $103,804 in the supplied Arab League GDP per capita (PPP) chart.
View image and data →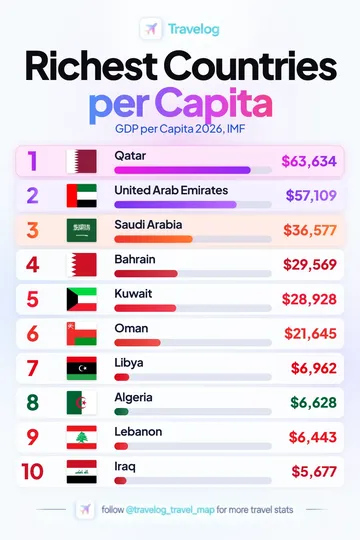
Qatar is listed first at $63,634 in the supplied Arab League GDP per capita chart.
View image and data →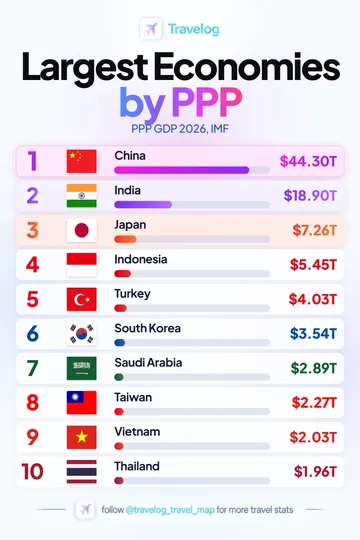
China is listed first at $44.30T in the supplied Asia GDP (PPP) chart.
View image and data →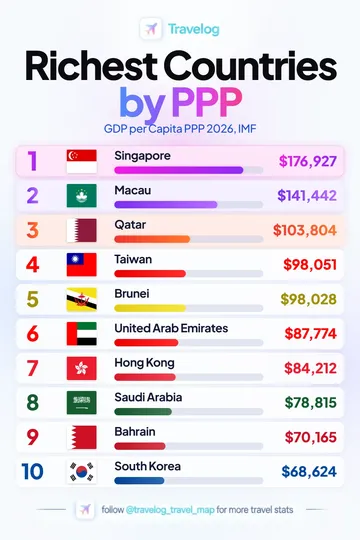
Singapore is listed first at $176,927 in the supplied Asia GDP per capita (PPP) chart.
View image and data →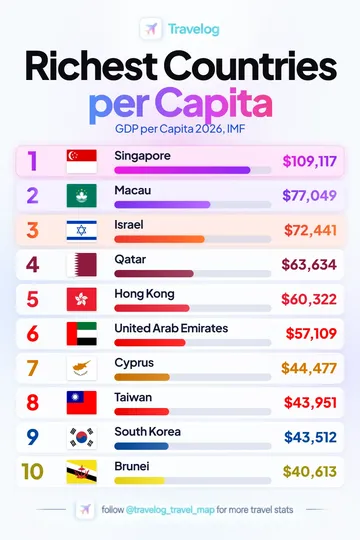
Singapore is listed first at $109,117 in the supplied Asia GDP per capita chart.
View image and data →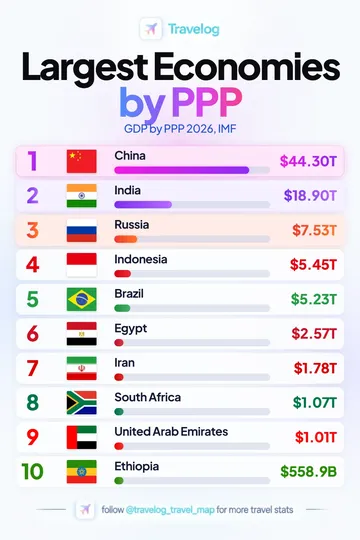
China is listed first at $44.30T in the supplied BRICS GDP (PPP) chart.
View image and data →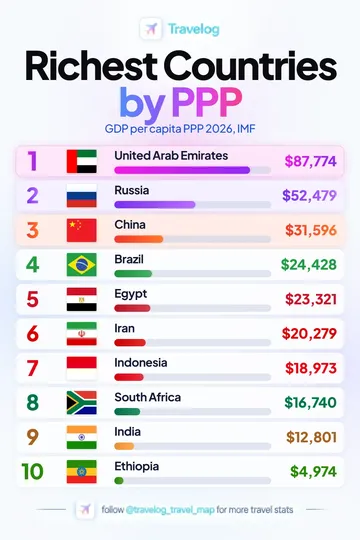
United Arab Emirates is listed first at $87,774 in the supplied BRICS GDP per capita (PPP) chart.
View image and data →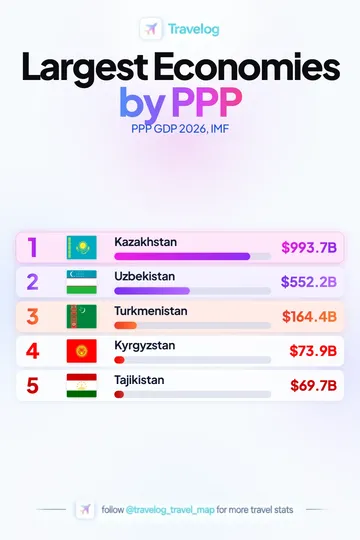
Kazakhstan is listed first at $993.7B in the supplied Central Asia GDP (PPP) chart.
View image and data →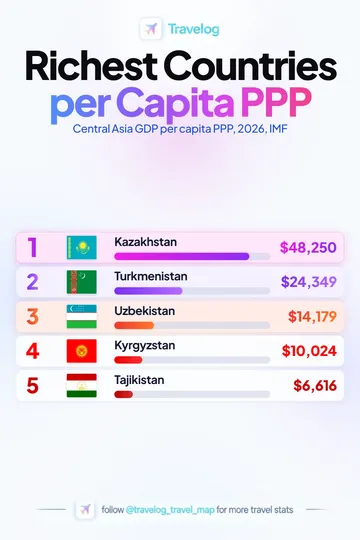
Kazakhstan is listed first at $48,250 in the supplied Central Asia GDP per capita (PPP) chart.
View image and data →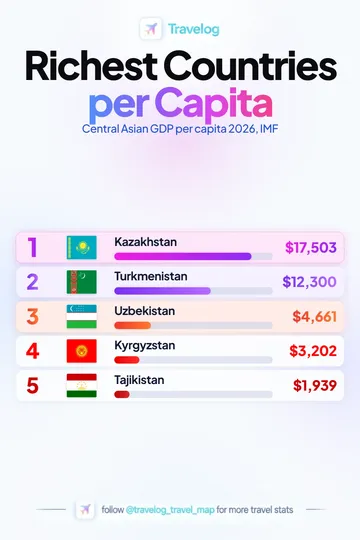
Kazakhstan is listed first at $17,503 in the supplied Central Asia GDP per capita chart.
View image and data →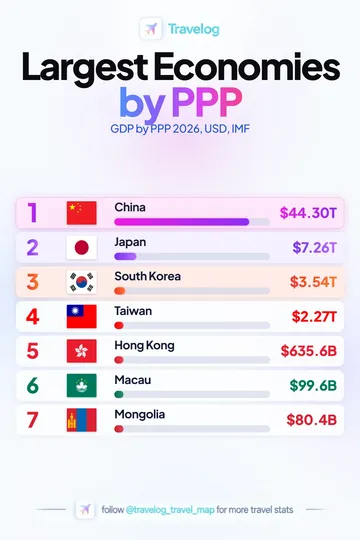
China is listed first at $44.30T in the supplied East Asia GDP (PPP) chart.
View image and data →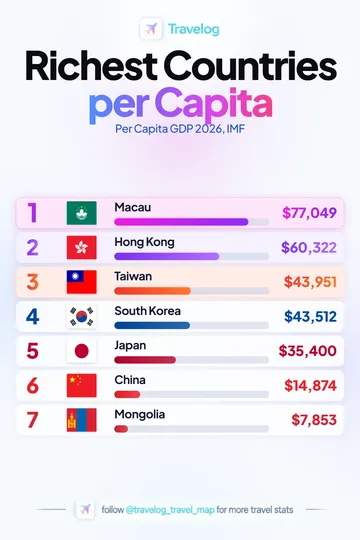
Macau is listed first at $77,049 in the supplied East Asia GDP per capita chart.
View image and data →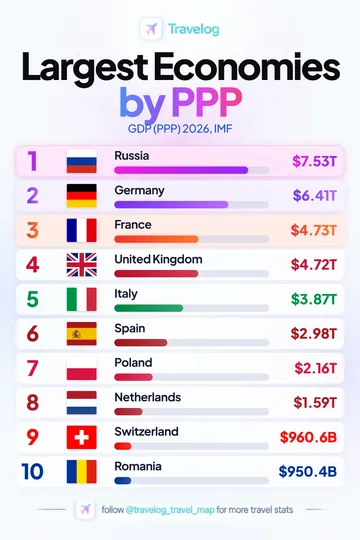
Russia is listed first at $7.53T in the supplied Europe GDP (PPP) chart.
View image and data →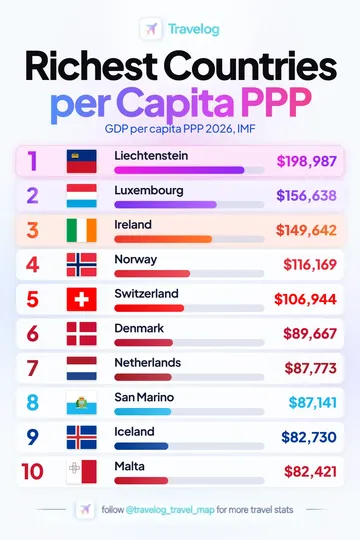
Liechtenstein is listed first at $198,987 in the supplied Europe GDP per capita (PPP) chart.
View image and data →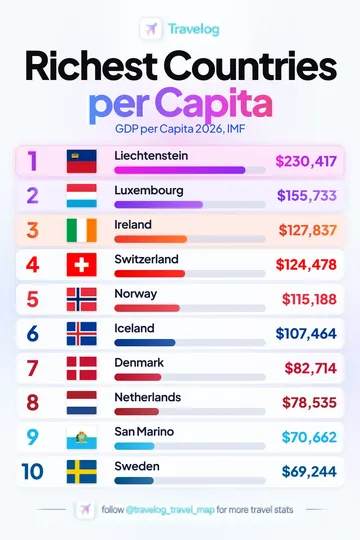
Liechtenstein is listed first at $230,417 in the supplied Europe GDP per capita chart.
View image and data →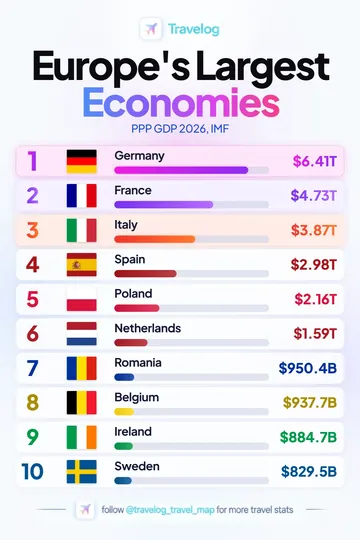
Germany is listed first at $6.41T in the supplied European Union GDP (PPP) chart.
View image and data →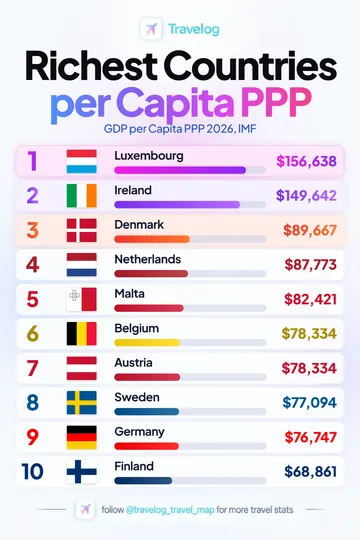
Luxembourg is listed first at $156,638 in the supplied European Union GDP per capita (PPP) chart.
View image and data →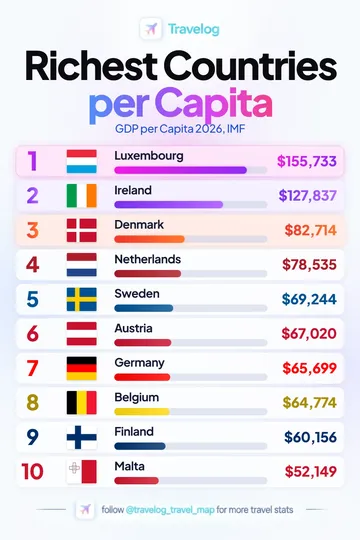
Luxembourg is listed first at $155,733 in the supplied European Union GDP per capita chart.
View image and data →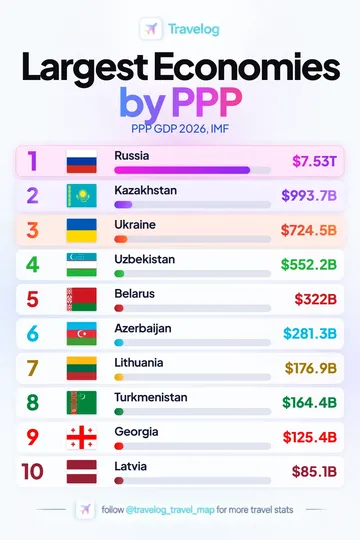
Russia is listed first at $7.53T in the supplied Former Soviet states GDP (PPP) chart.
View image and data →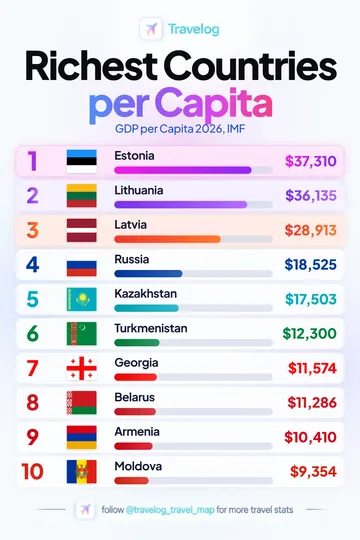
Estonia is listed first at $37,310 in the supplied Former Soviet states GDP per capita chart.
View image and data →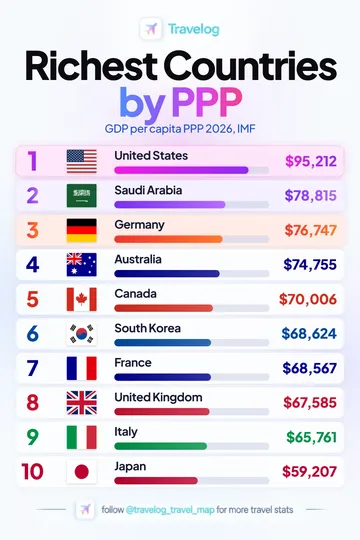
United States is listed first at $95,212 in the supplied G20 GDP per capita (PPP) chart.
View image and data →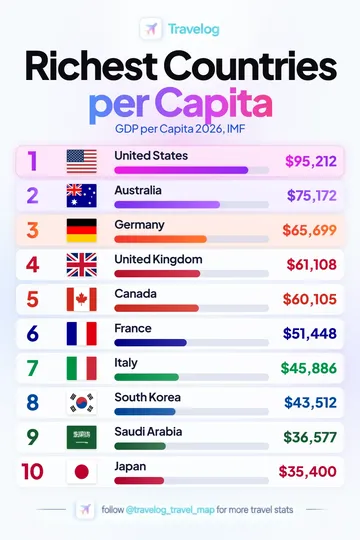
United States is listed first at $95,212 in the supplied G20 GDP per capita chart.
View image and data →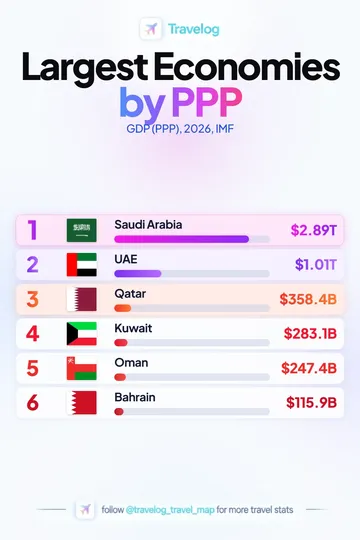
Saudi Arabia is listed first at $2.89T in the supplied GCC GDP (PPP) chart.
View image and data →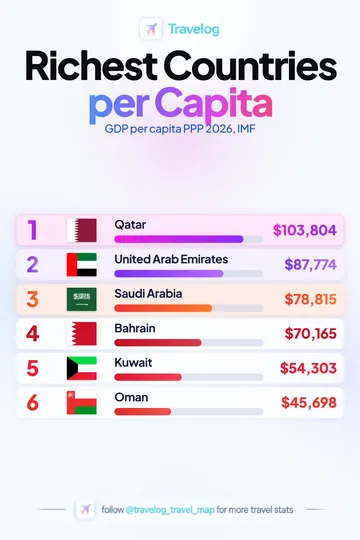
Qatar is listed first at $103,804 in the supplied GCC GDP per capita (PPP) chart.
View image and data →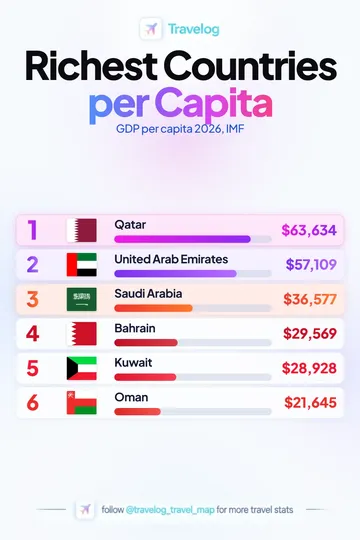
Qatar is listed first at $63,634 in the supplied GCC GDP per capita chart.
View image and data →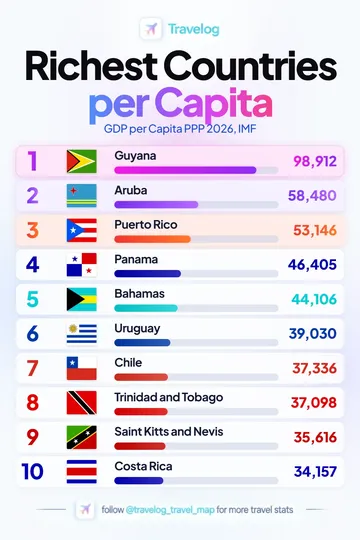
Guyana is listed first at 98,912 in the supplied Latin America and Caribbean GDP per capita (PPP) chart.
View image and data →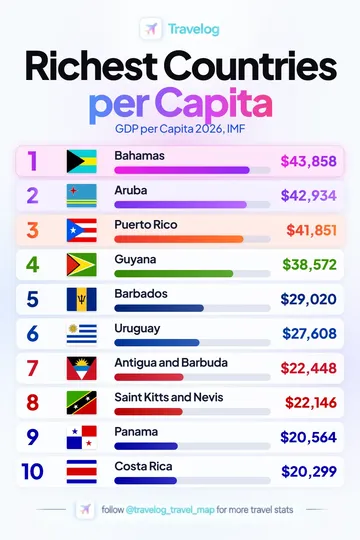
Bahamas is listed first at $43,858 in the supplied Latin America and Caribbean GDP per capita chart.
View image and data →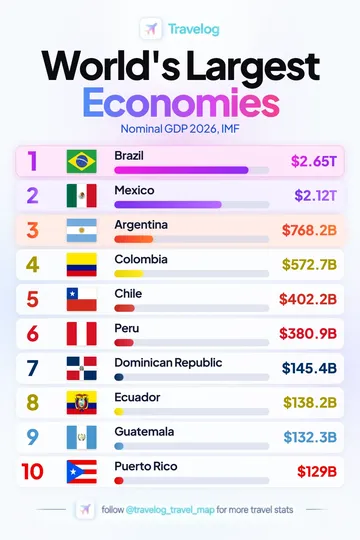
Brazil is listed first at $2.65T in the supplied Latin America and Caribbean Nominal GDP chart.
View image and data →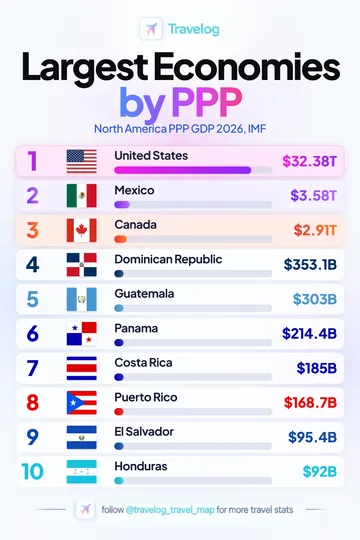
United States is listed first at $32.38T in the supplied North America, Central America and Caribbean GDP (PPP) chart.
View image and data →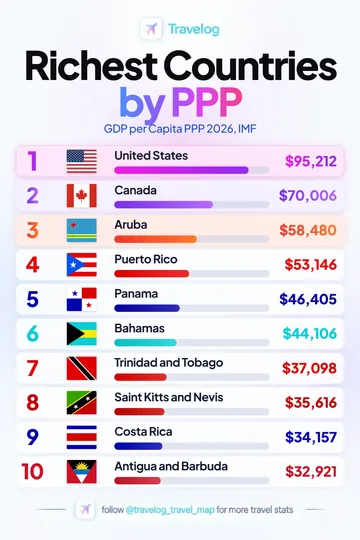
United States is listed first at $95,212 in the supplied North America, Central America and Caribbean GDP per capita (PPP) chart.
View image and data →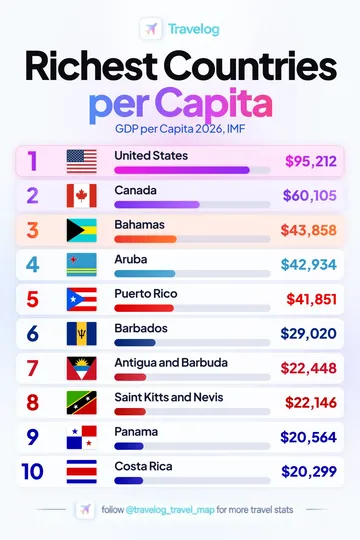
United States is listed first at $95,212 in the supplied North America, Central America and Caribbean GDP per capita chart.
View image and data →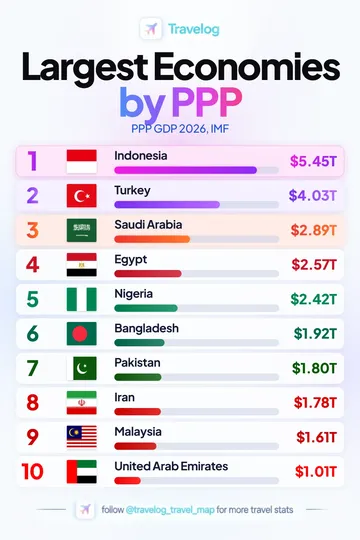
Indonesia is listed first at $5.45T in the supplied OIC major countries GDP (PPP) chart.
View image and data →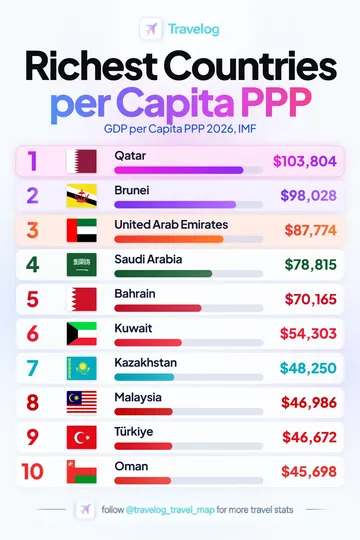
Qatar is listed first at $103,804 in the supplied OIC major countries GDP per capita (PPP) chart.
View image and data →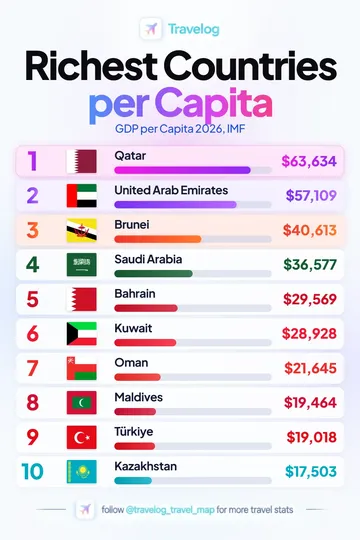
Qatar is listed first at $63,634 in the supplied OIC major countries GDP per capita chart.
View image and data →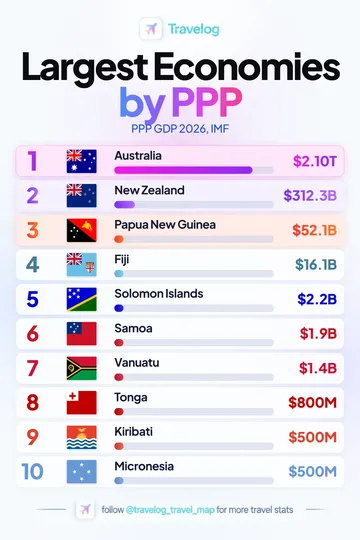
Australia is listed first at $2.10T in the supplied Oceania GDP (PPP) chart.
View image and data →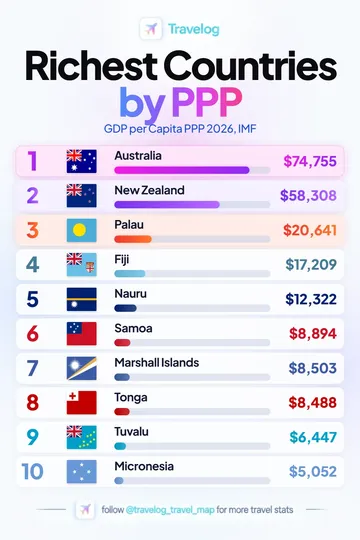
Australia is listed first at $74,755 in the supplied Oceania GDP per capita (PPP) chart.
View image and data →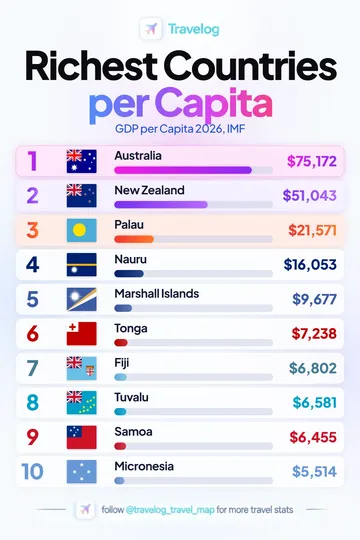
Australia is listed first at $75,172 in the supplied Oceania GDP per capita chart.
View image and data →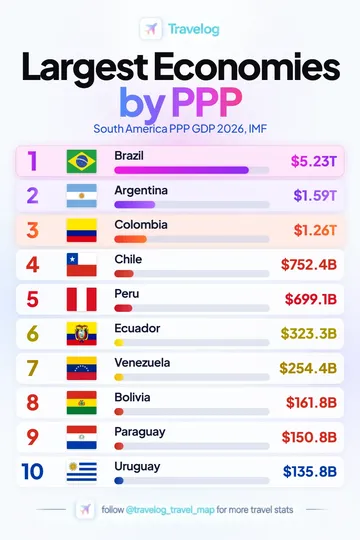
Brazil is listed first at $5.23T in the supplied South America GDP (PPP) chart.
View image and data →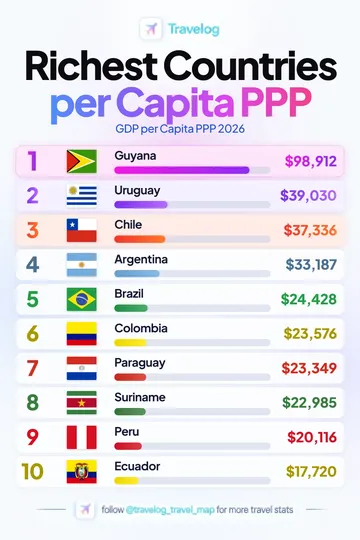
Guyana is listed first at $98,912 in the supplied South America GDP per capita (PPP) chart.
View image and data →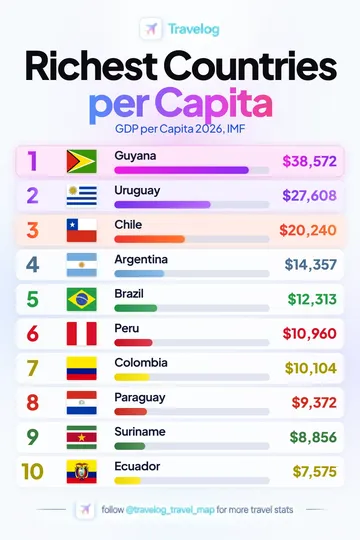
Guyana is listed first at $38,572 in the supplied South America GDP per capita chart.
View image and data →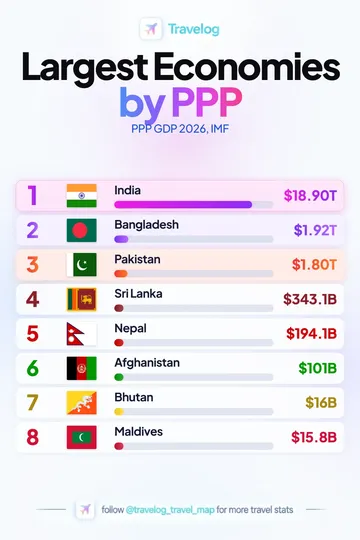
India is listed first at $18.90T in the supplied South Asia GDP (PPP) chart.
View image and data →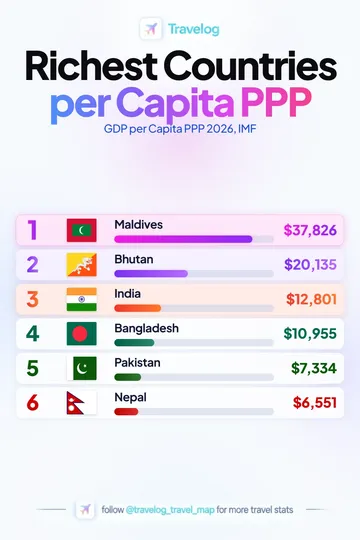
Maldives is listed first at $37,826 in the supplied South Asia GDP per capita (PPP) chart.
View image and data →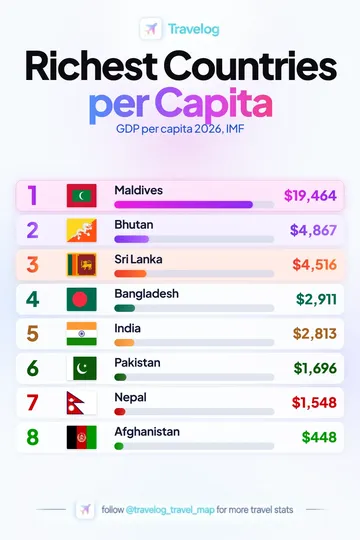
Maldives is listed first at $19,464 in the supplied South Asia GDP per capita chart.
View image and data →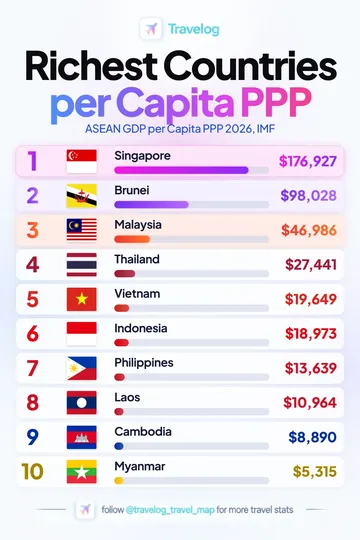
Singapore is listed first at $176,927 in the supplied Southeast Asia GDP per capita (PPP) chart.
View image and data →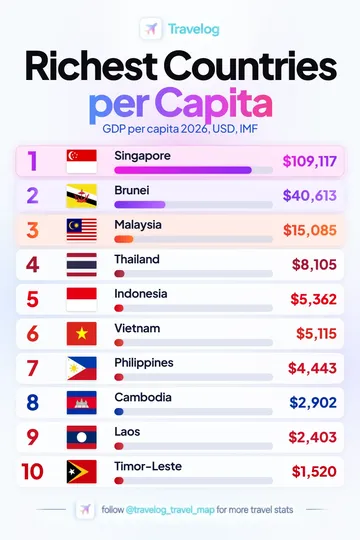
Singapore is listed first at $109,117 in the supplied Southeast Asia GDP per capita chart.
View image and data →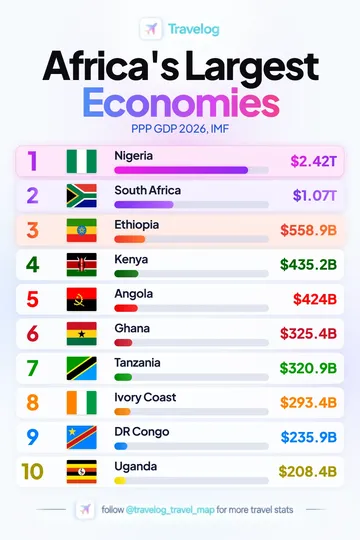
Nigeria is listed first at $2.42T in the supplied Sub-Saharan Africa GDP (PPP) chart.
View image and data →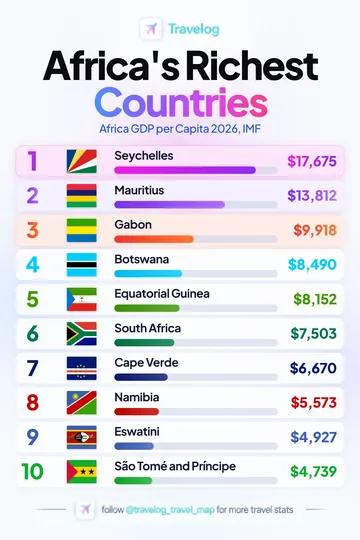
Seychelles is listed first at $17,675 in the supplied Sub-Saharan Africa GDP per capita chart.
View image and data →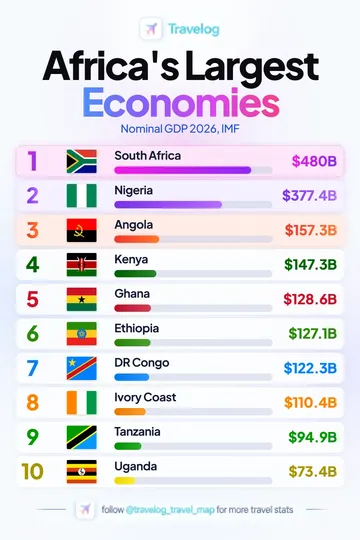
South Africa is listed first at $480B in the supplied Sub-Saharan Africa Nominal GDP chart.
View image and data →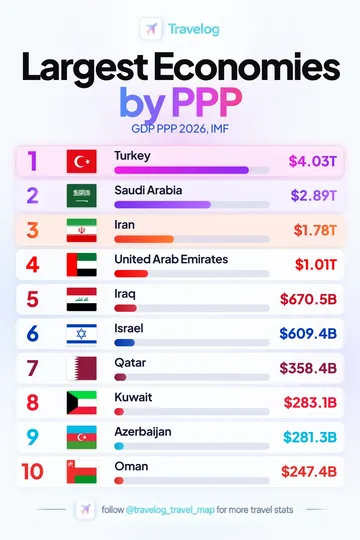
Turkey is listed first at $4.03T in the supplied West Asia and Middle East GDP (PPP) chart.
View image and data →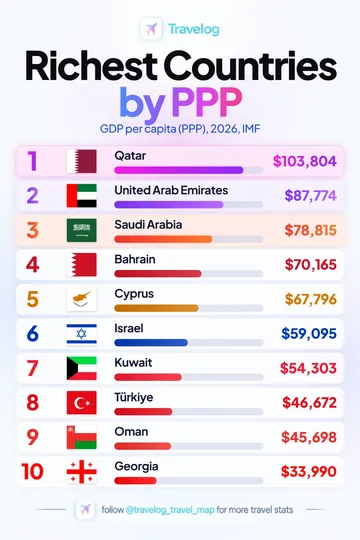
Qatar is listed first at $103,804 in the supplied West Asia and Middle East GDP per capita (PPP) chart.
View image and data →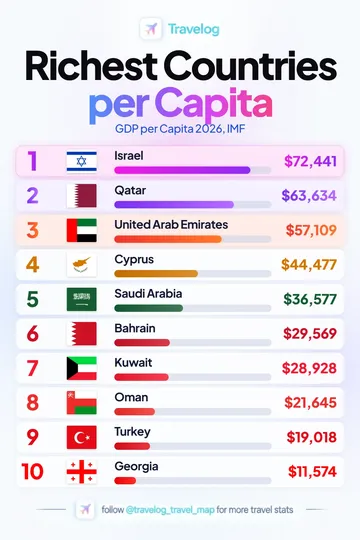
Israel is listed first at $72,441 in the supplied West Asia and Middle East GDP per capita chart.
View image and data →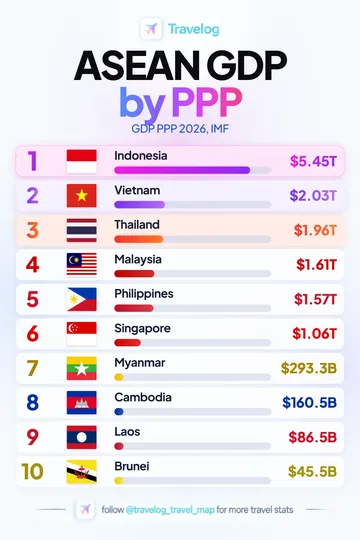
Indonesia is listed first at $5.45T in this supplied graphic. GDP PPP 2026, IMF.
View image and data →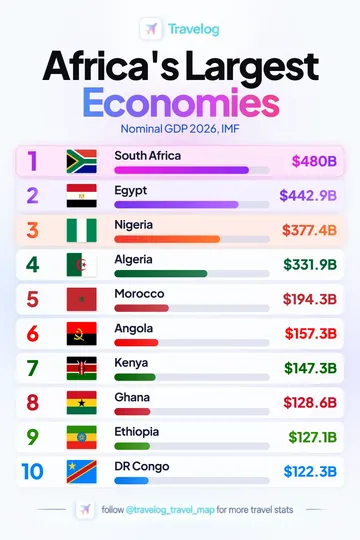
South Africa is listed first at $480B in this supplied graphic. Nominal GDP 2026, IMF.
View image and data →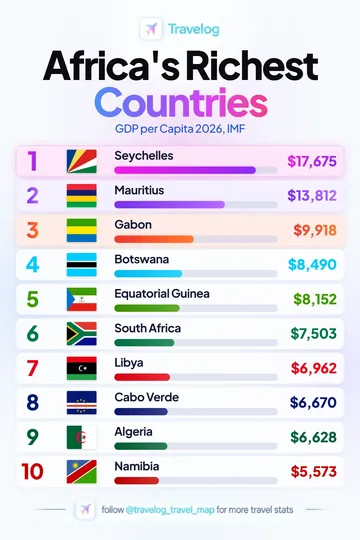
Seychelles is listed first at $17,675 in this supplied graphic. GDP per Capita 2026, IMF.
View image and data →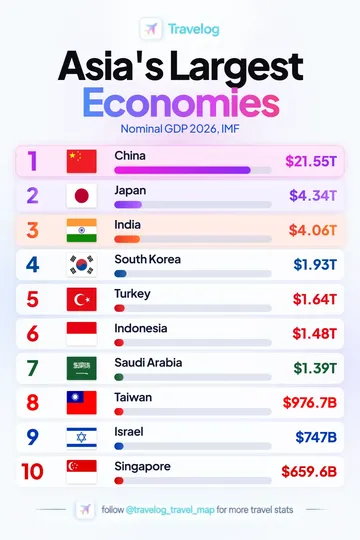
China is listed first at $21.55T in this supplied graphic. Nominal GDP 2026, IMF.
View image and data →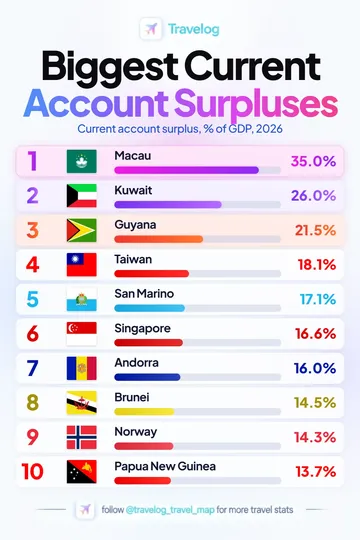
Macau is listed first at 35.0% in this supplied graphic. Current account surplus, % of GDP, 2026.
View image and data →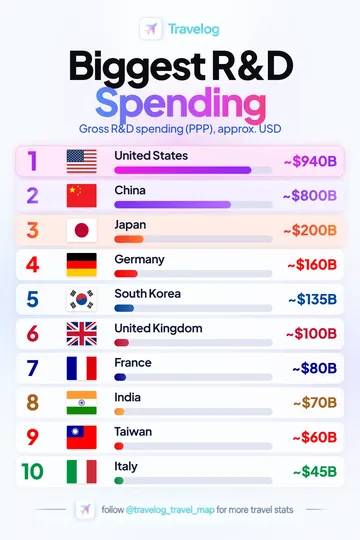
United States is listed first at ~$940B in this supplied graphic. Gross R&D spending (PPP), approx. USD.
View image and data →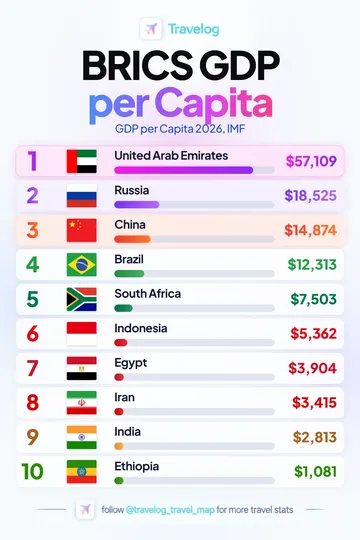
United Arab Emirates is listed first at $57,109 in this supplied graphic. GDP per Capita 2026, IMF.
View image and data →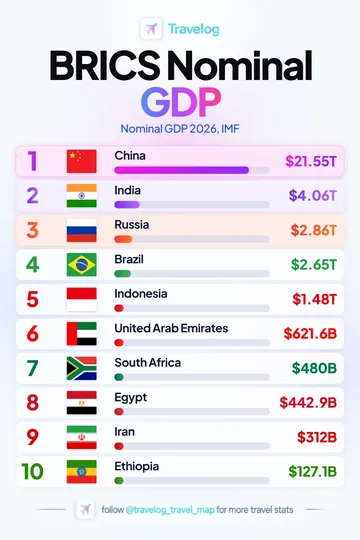
China is listed first at $21.55T in this supplied graphic. Nominal GDP 2026, IMF.
View image and data →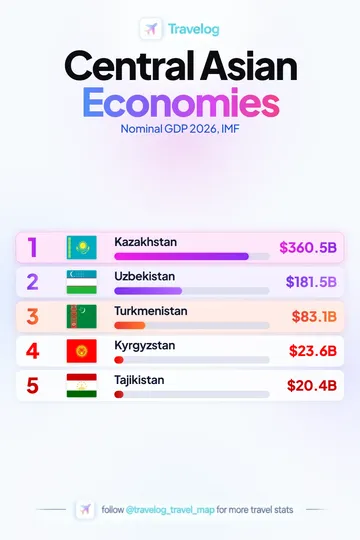
Kazakhstan is listed first at $360.5B in this supplied graphic. Nominal GDP 2026, IMF.
View image and data →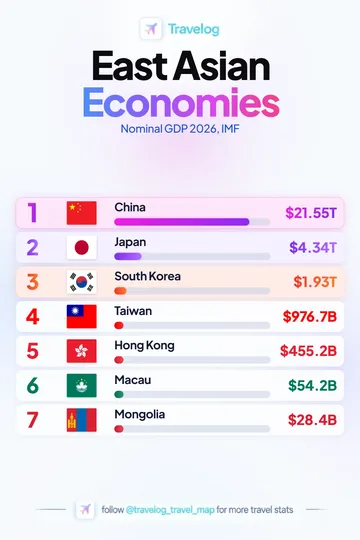
China is listed first at $21.55T in this supplied graphic. Nominal GDP 2026, IMF.
View image and data →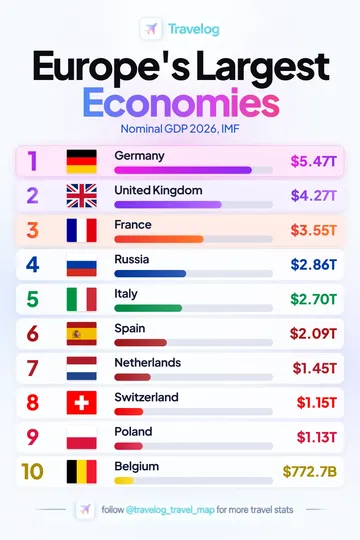
Germany is listed first at $5.47T in this supplied graphic. Nominal GDP 2026, IMF.
View image and data →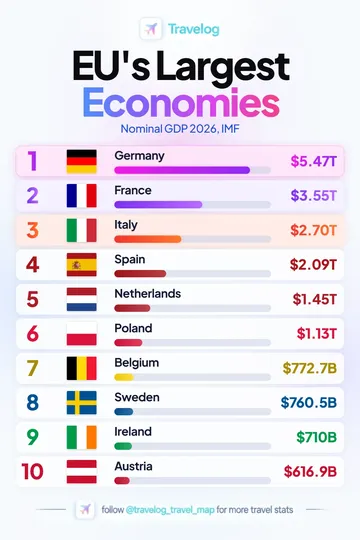
Germany is listed first at $5.47T in this supplied graphic. Nominal GDP 2026, IMF.
View image and data →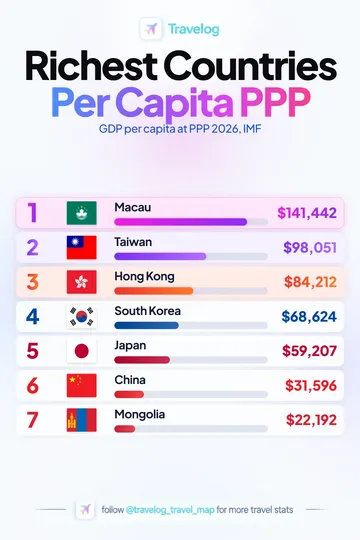
Macau is listed first at $141,442 in this supplied graphic. GDP per capita at PPP 2026, IMF.
View image and data →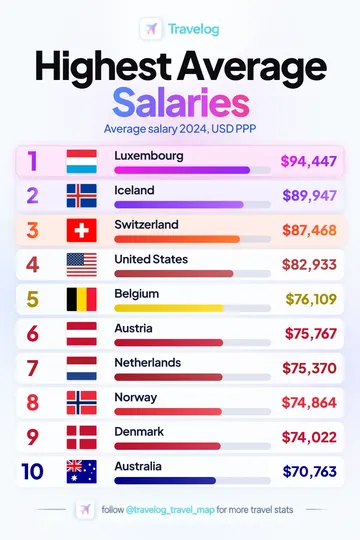
Luxembourg is listed first at $94,447 in this supplied graphic. Average salary 2024, USD PPP.
View image and data →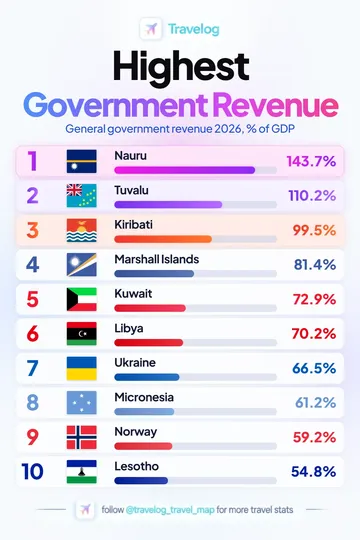
Nauru is listed first at 143.7% in this supplied graphic. General government revenue 2026, % of GDP.
View image and data →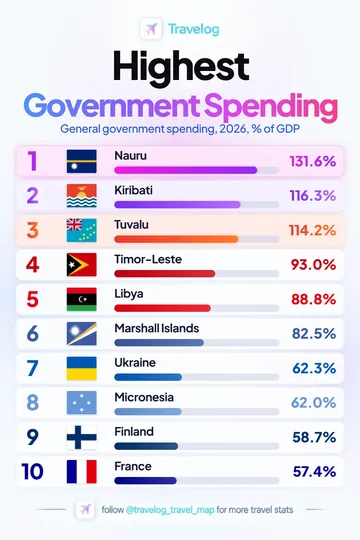
Nauru is listed first at 131.6% in this supplied graphic. General government spending, 2026, % of GDP.
View image and data →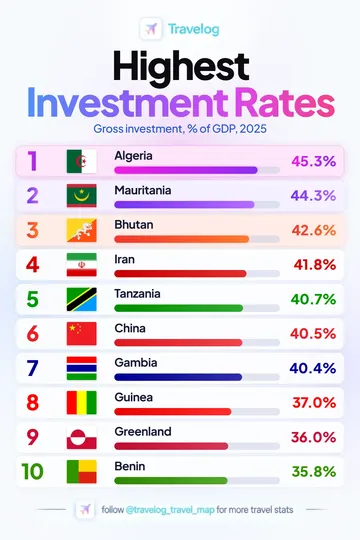
Algeria is listed first at 45.3% in this supplied graphic. Gross investment, % of GDP, 2025.
View image and data →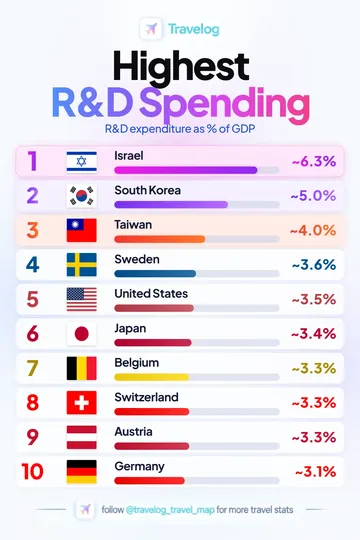
Israel is listed first at ~6.3% in this supplied graphic. R&D expenditure as % of GDP.
View image and data →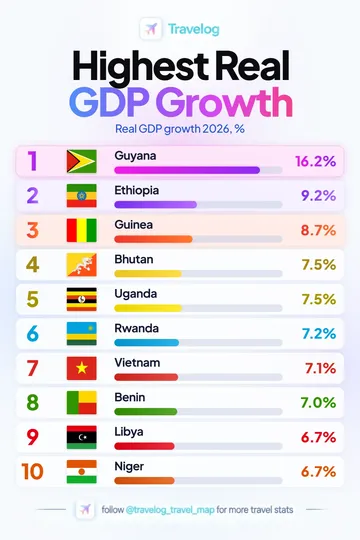
Guyana is listed first at 16.2% in this supplied graphic. Real GDP growth 2026, %.
View image and data →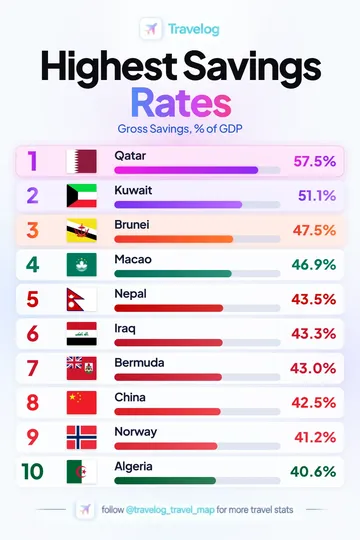
Qatar is listed first at 57.5% in this supplied graphic. Gross Savings, % of GDP.
View image and data →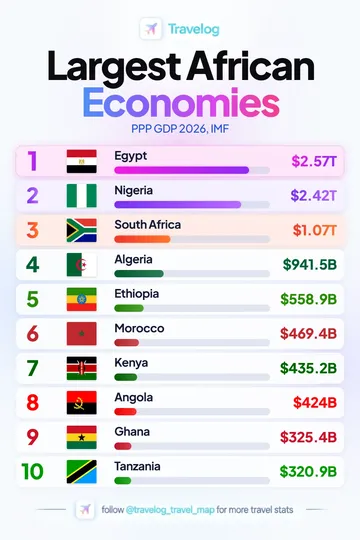
Egypt is listed first at $2.57T in this supplied graphic. PPP GDP 2026, IMF.
View image and data →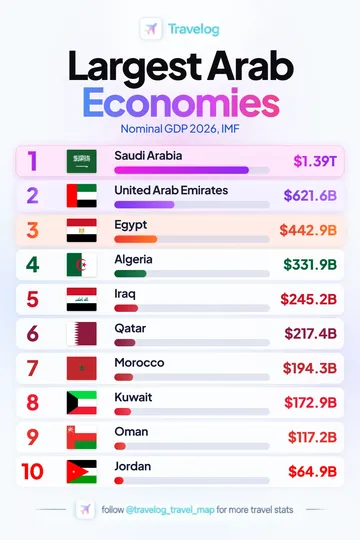
Saudi Arabia is listed first at $1.39T in this supplied graphic. Nominal GDP 2026, IMF.
View image and data →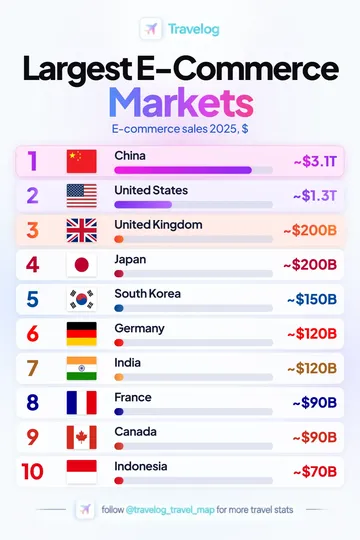
China is listed first at ~$3.1T in this supplied graphic. E-commerce sales 2025, $.
View image and data →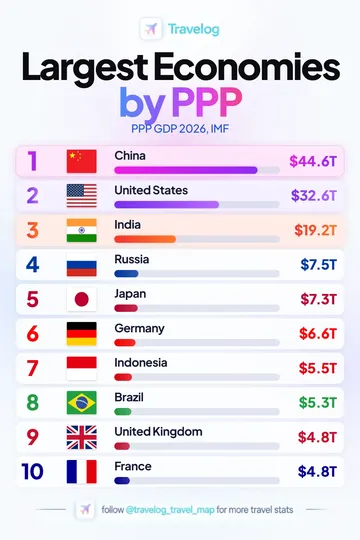
China is listed first at $44.6T in this supplied graphic. PPP GDP 2026, IMF.
View image and data →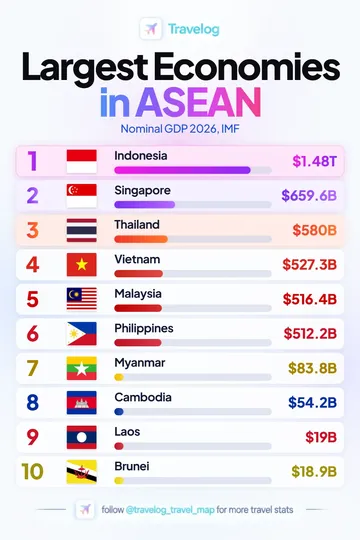
Indonesia is listed first at $1.48T in this supplied graphic. Nominal GDP 2026, IMF.
View image and data →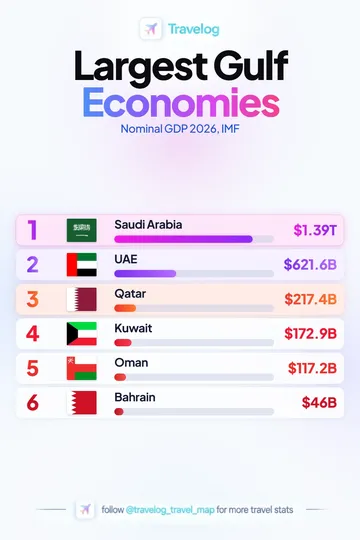
Saudi Arabia is listed first at $1.39T in this supplied graphic. Nominal GDP 2026, IMF.
View image and data →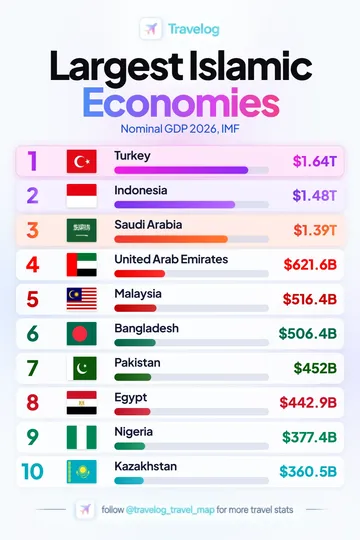
Turkey is listed first at $1.64T in this supplied graphic. Nominal GDP 2026, IMF.
View image and data →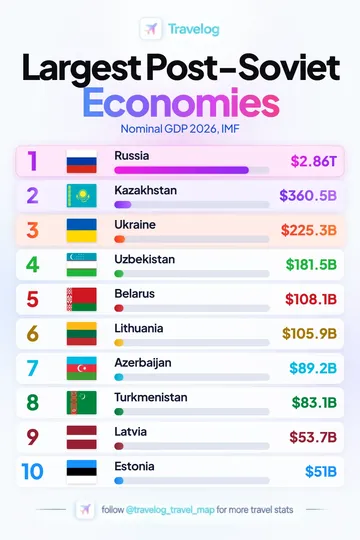
Russia is listed first at $2.86T in this supplied graphic. Nominal GDP 2026, IMF.
View image and data →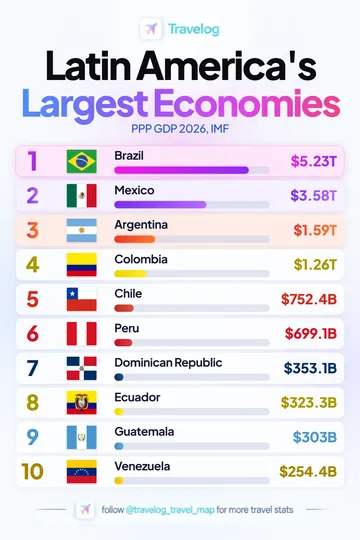
Brazil is listed first at $5.23T in this supplied graphic. PPP GDP 2026, IMF.
View image and data →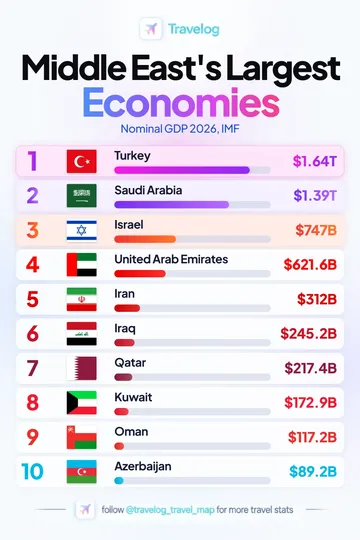
Turkey is listed first at $1.64T in this supplied graphic. Nominal GDP 2026, IMF.
View image and data →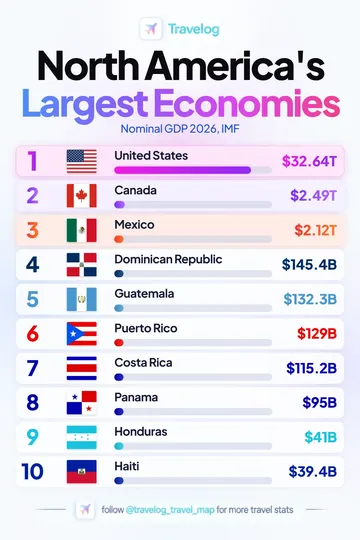
United States is listed first at $32.64T in this supplied graphic. Nominal GDP 2026, IMF.
View image and data →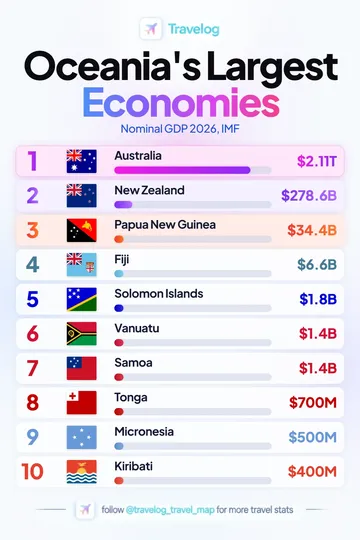
Australia is listed first at $2.11T in this supplied graphic. Nominal GDP 2026, IMF.
View image and data →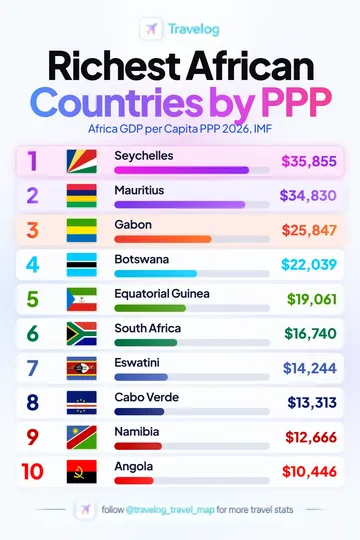
Seychelles is listed first at $35,855 in this supplied graphic. Africa GDP per Capita PPP 2026, IMF.
View image and data →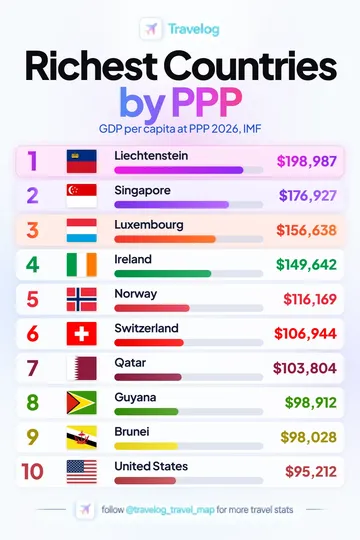
Liechtenstein is listed first at $198,987 in this supplied graphic. GDP per capita at PPP 2026, IMF.
View image and data →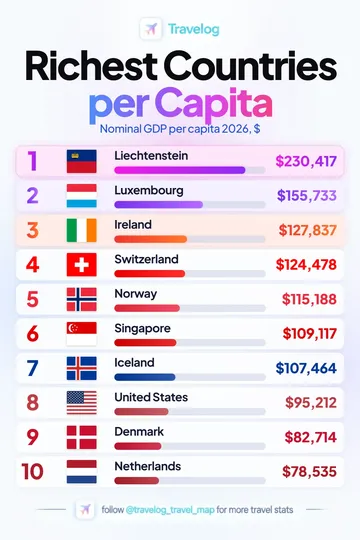
Liechtenstein is listed first at $230,417 in this supplied graphic. Nominal GDP per capita 2026, $.
View image and data →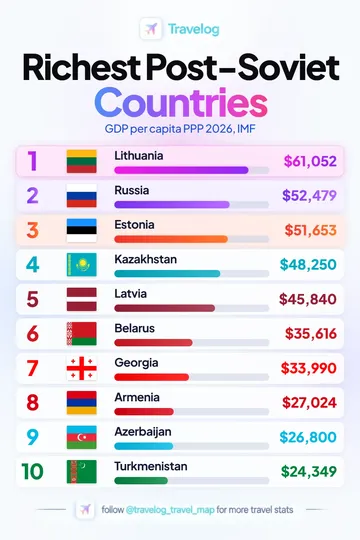
Lithuania is listed first at $61,052 in this supplied graphic. GDP per capita PPP 2026, IMF.
View image and data →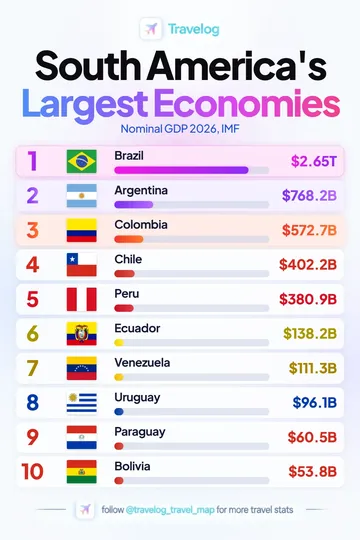
Brazil is listed first at $2.65T in this supplied graphic. Nominal GDP 2026, IMF.
View image and data →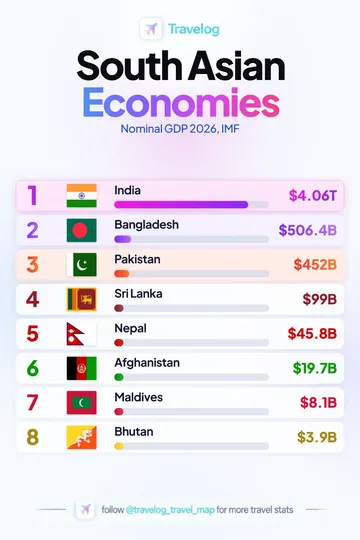
India is listed first at $4.06T in this supplied graphic. Nominal GDP 2026, IMF.
View image and data →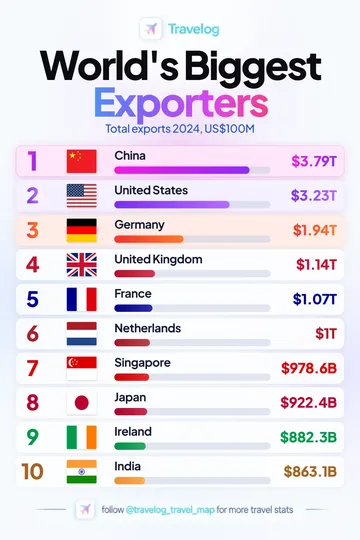
China is listed first at $3.79T in this supplied graphic. Total exports 2024, US$100M.
View image and data →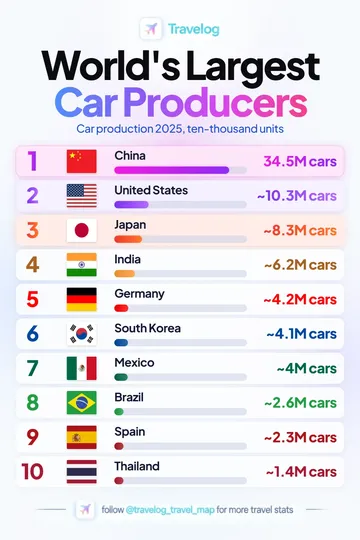
China is listed first at 34.5M cars in this supplied graphic. Car production 2025, ten-thousand units.
View image and data →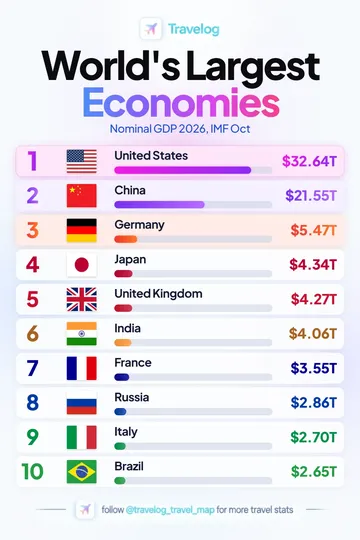
United States is listed first at $32.64T in this supplied graphic. Nominal GDP 2026, IMF Oct.
View image and data →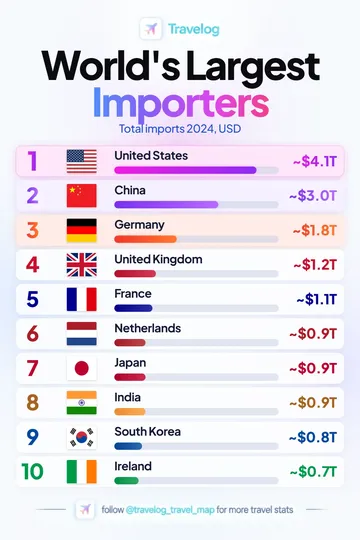
United States is listed first at ~$4.1T in this supplied graphic. Total imports 2024, USD.
View image and data →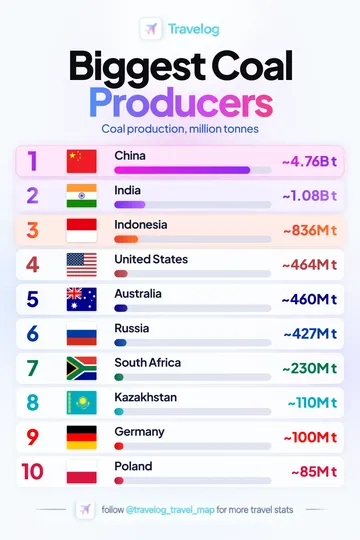
China is listed first at ~4.76Bt in this supplied graphic. Coal production, million tonnes.
View image and data →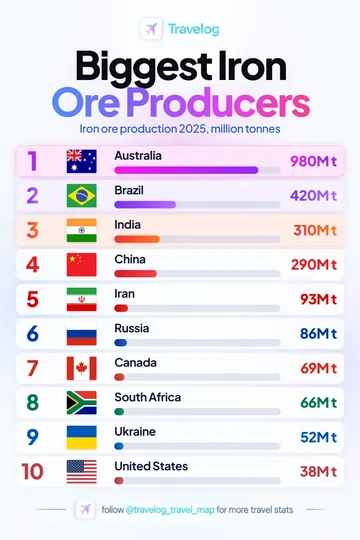
Australia is listed first at 980Mt in this supplied graphic. Iron ore production 2025, million tonnes.
View image and data →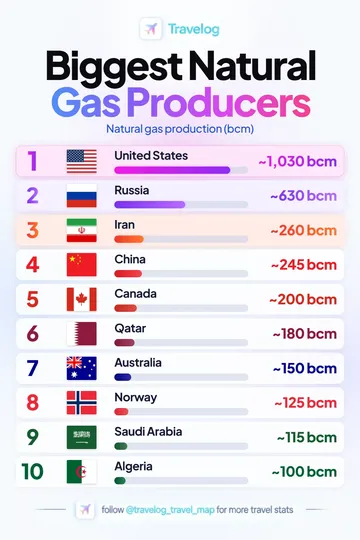
United States is listed first at ~1,030 bcm in this supplied graphic. Natural gas production (bcm).
View image and data →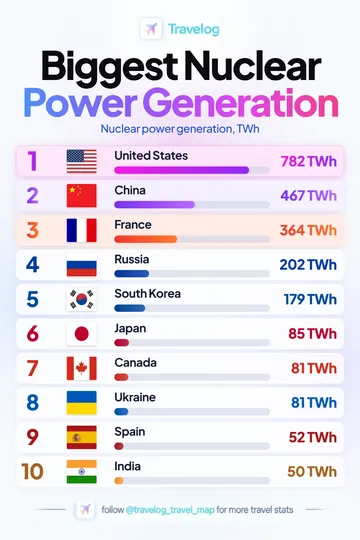
United States is listed first at 782TWh in this supplied graphic. Nuclear power generation, TWh.
View image and data →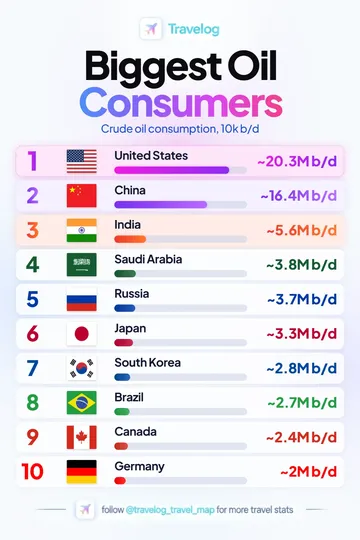
United States is listed first at ~20.3M b/d in this supplied graphic. Crude oil consumption, 10k b/d.
View image and data →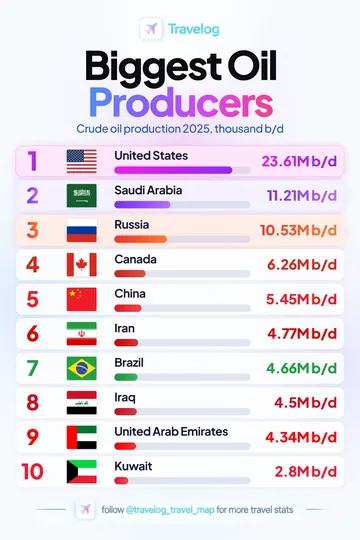
United States is listed first at 23.61M b/d in this supplied graphic. Crude oil production 2025, thousand b/d.
View image and data →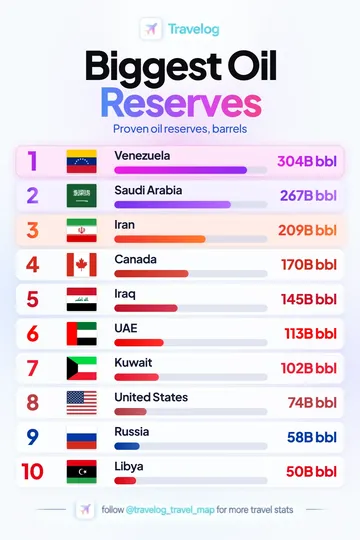
Venezuela is listed first at 304B bbl in this supplied graphic. Proven oil reserves, barrels.
View image and data →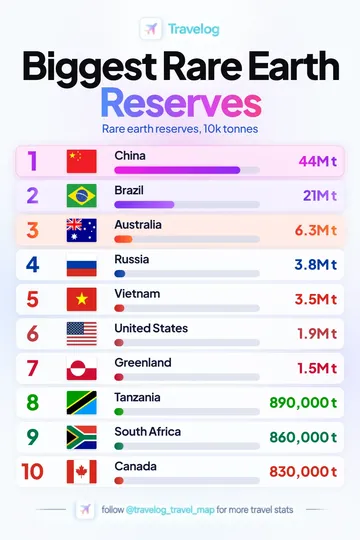
China is listed first at 44Mt in this supplied graphic. Rare earth reserves, 10k tonnes.
View image and data →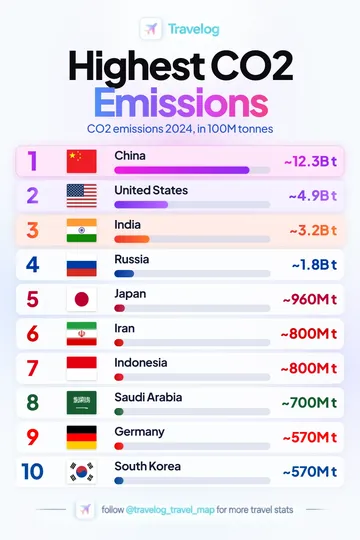
China is listed first at ~12.3Bt in this supplied graphic. CO2 emissions 2024, in 100M tonnes.
View image and data →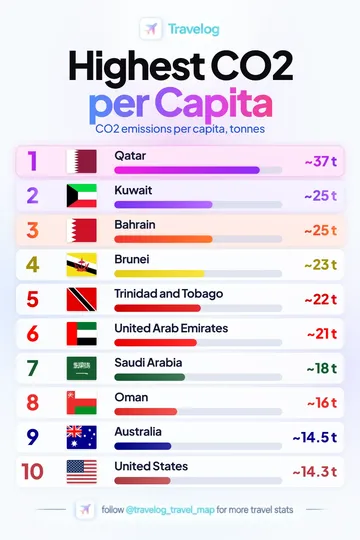
Qatar is listed first at ~37 t in this supplied graphic. CO2 emissions per capita, tonnes.
View image and data →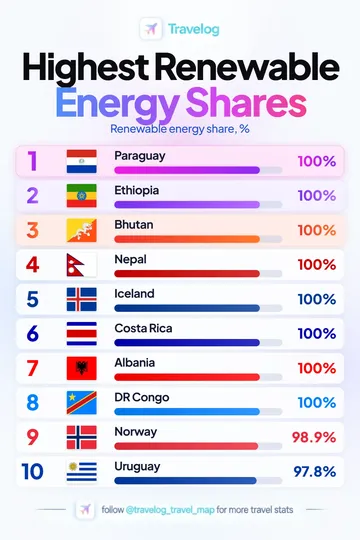
Paraguay is listed first at 100% in this supplied graphic. Renewable energy share, %.
View image and data →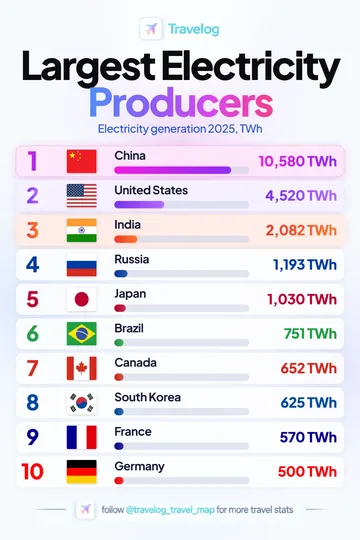
China is listed first at 10,580TWh in this supplied graphic. Electricity generation 2025, TWh.
View image and data →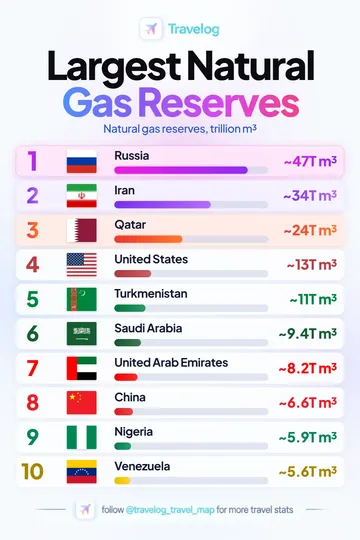
Russia is listed first at ~47T m³ in this supplied graphic. Natural gas reserves, trillion m³.
View image and data →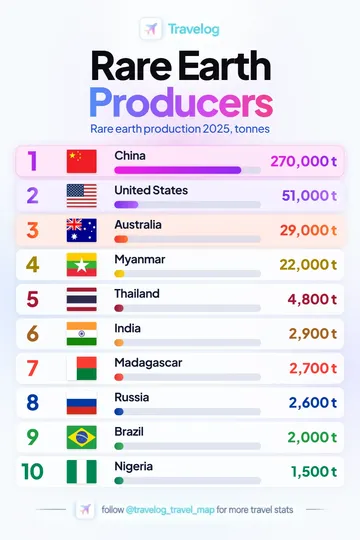
China is listed first at 270,000t in this supplied graphic. Rare earth production 2025, tonnes.
View image and data →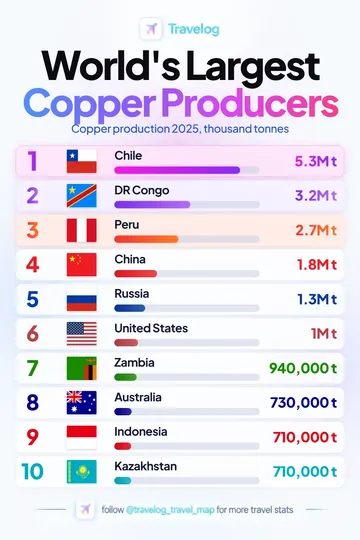
Chile is listed first at 5.3Mt in this supplied graphic. Copper production 2025, thousand tonnes.
View image and data →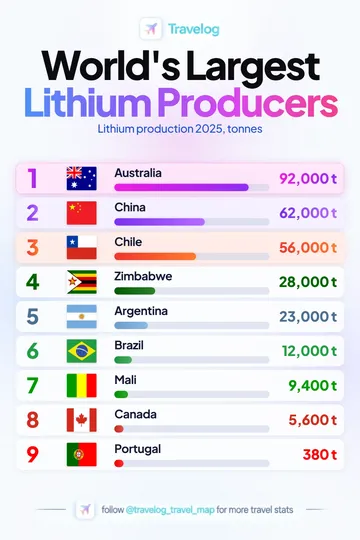
Australia is listed first at 92,000t in this supplied graphic. Lithium production 2025, tonnes.
View image and data →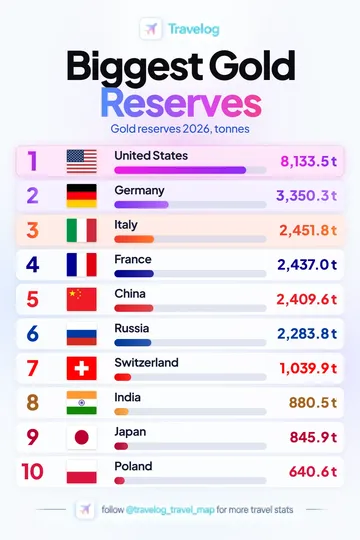
United States is listed first at 8,133.5 t in this supplied graphic. Gold reserves 2026, tonnes.
View image and data →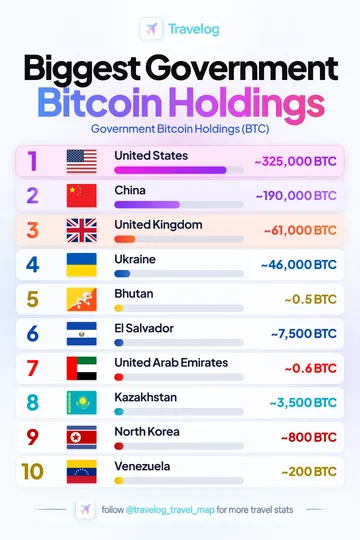
United States is listed first at ~325,000 BTC in this supplied graphic. Government Bitcoin Holdings (BTC).
View image and data →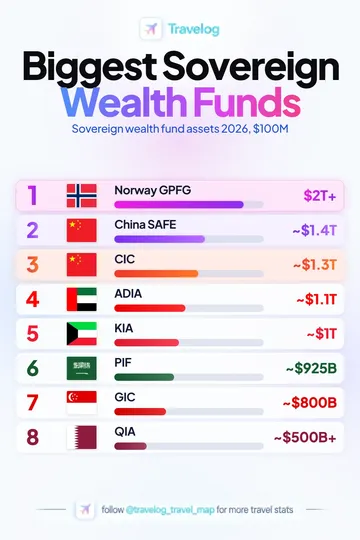
Norway GPFG is listed first at $2T+ in this supplied graphic. Sovereign wealth fund assets 2026, $100M.
View image and data →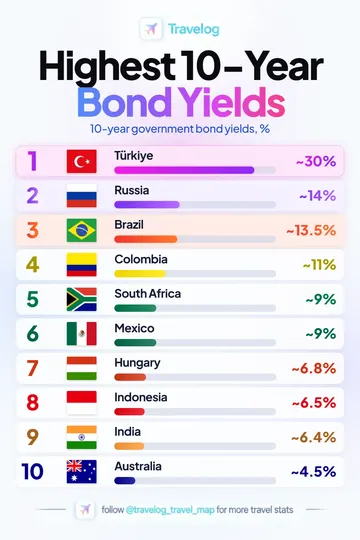
Türkiye is listed first at ~30% in this supplied graphic. 10-year government bond yields, %.
View image and data →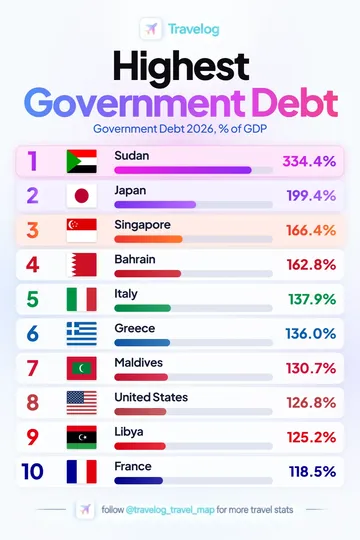
Sudan is listed first at 334.4% in this supplied graphic. Government Debt 2026, % of GDP.
View image and data →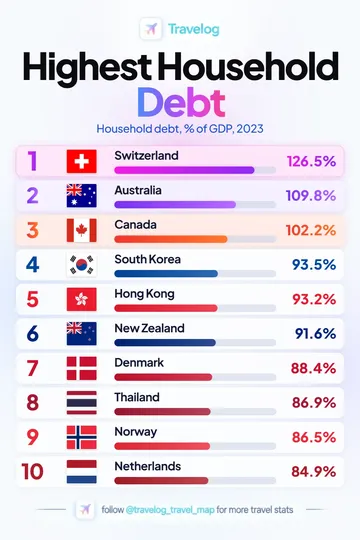
Switzerland is listed first at 126.5% in this supplied graphic. Household debt, % of GDP, 2023.
View image and data →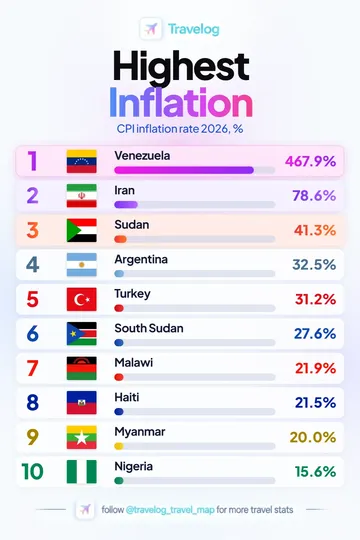
Venezuela is listed first at 467.9% in this supplied graphic. CPI inflation rate 2026, %.
View image and data →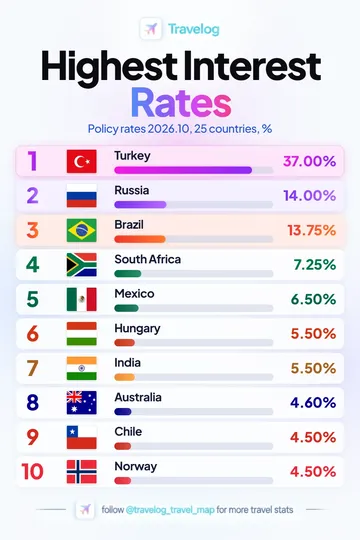
Turkey is listed first at 37.00% in this supplied graphic. Policy rates 2026.10, 25 countries, %.
View image and data →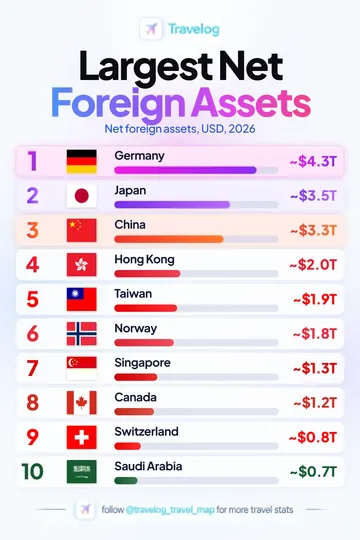
Germany is listed first at ~$4.3T in this supplied graphic. Net foreign assets, USD, 2026.
View image and data →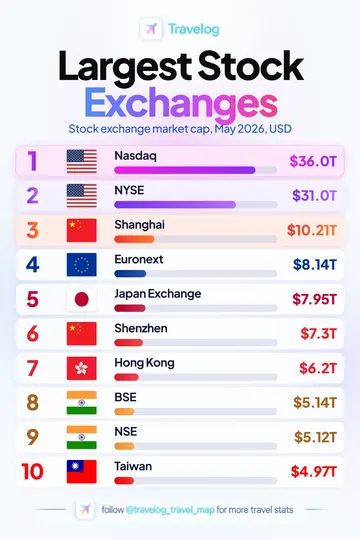
Nasdaq is listed first at $36.0T in this supplied graphic. Stock exchange market cap, May 2026, USD.
View image and data →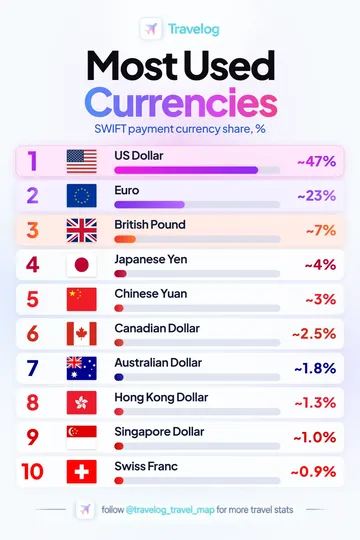
US Dollar is listed first at ~47% in this supplied graphic. SWIFT payment currency share, %.
View image and data →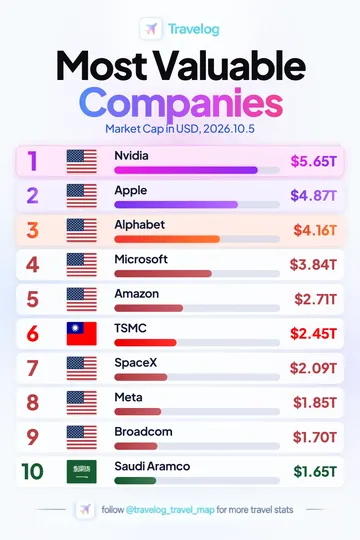
Nvidia is listed first at $5.65T in this supplied graphic. Market Cap in USD, 2026.10.5.
View image and data →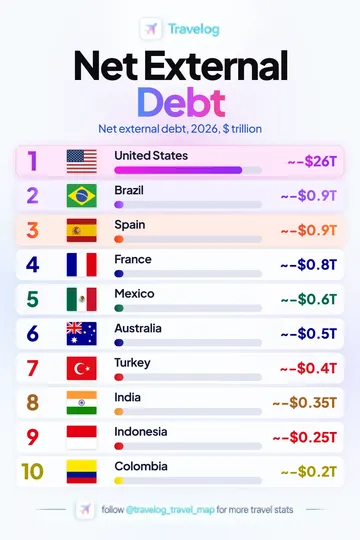
United States is listed first at ~−$26T in this supplied graphic. Net external debt, 2026, $ trillion.
View image and data →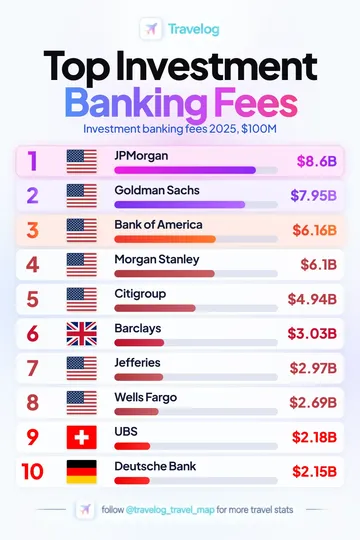
JPMorgan is listed first at $8.6B in this supplied graphic. Investment banking fees 2025, $100M.
View image and data →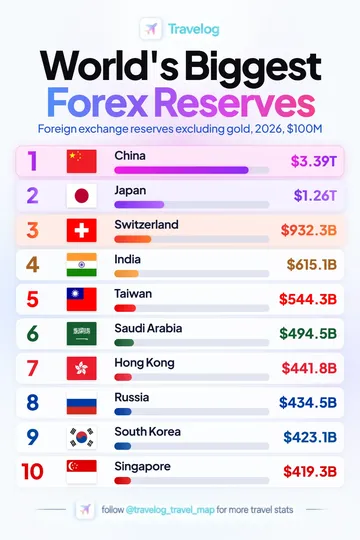
China is listed first at $3.39T in this supplied graphic. Foreign exchange reserves excluding gold, 2026, $100M.
View image and data →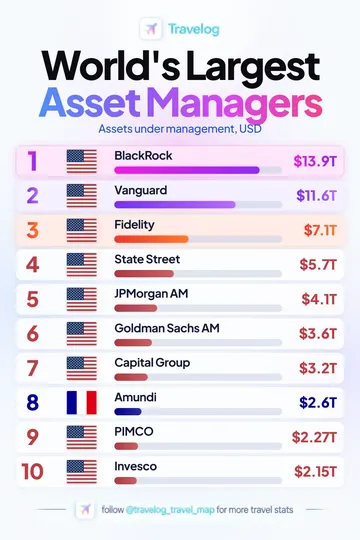
BlackRock is listed first at $13.9T in this supplied graphic. Assets under management, USD.
View image and data →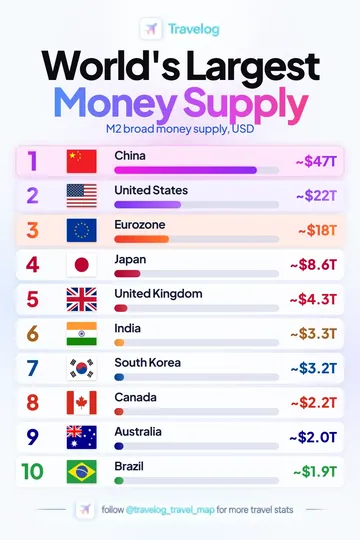
China is listed first at ~$47T in this supplied graphic. M2 broad money supply, USD.
View image and data →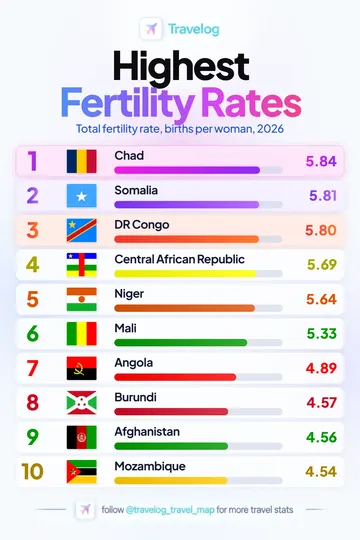
Chad is listed first at 5.84 in this supplied graphic. Total fertility rate, births per woman, 2026.
View image and data →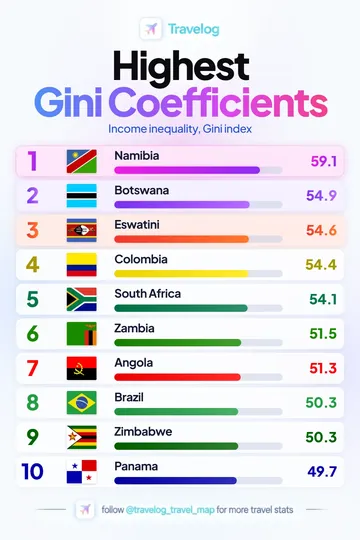
Namibia is listed first at 59.1 in this supplied graphic. Income inequality, Gini index.
View image and data →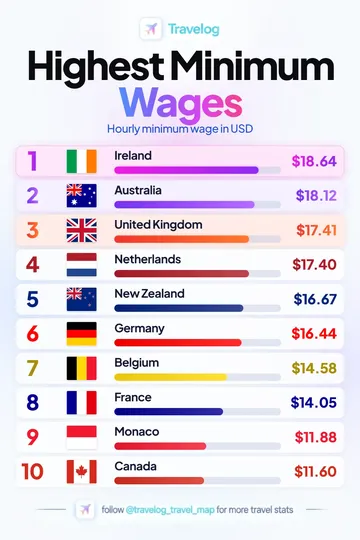
Ireland is listed first at $18.64 in this supplied graphic. Hourly minimum wage in USD.
View image and data →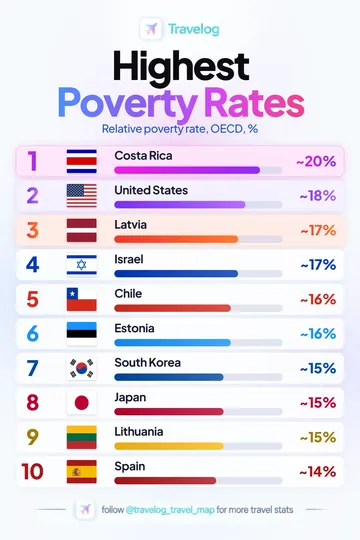
Costa Rica is listed first at ~20% in this supplied graphic. Relative poverty rate, OECD, %.
View image and data →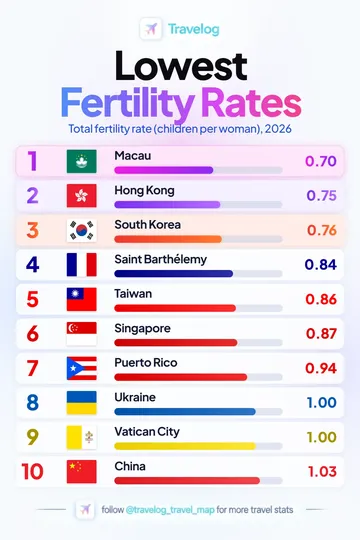
Macau is listed first at 0.70 in this supplied graphic. Total fertility rate (children per woman), 2026.
View image and data →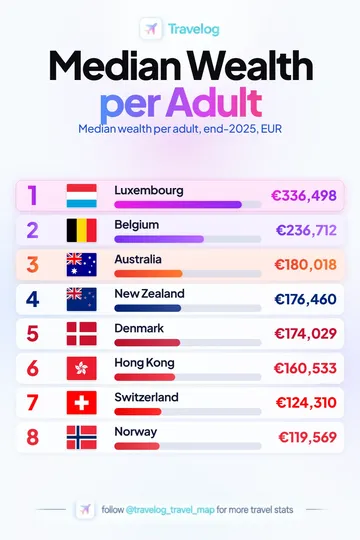
Luxembourg is listed first at €336,498 in this supplied graphic. Median wealth per adult, end-2025, EUR.
View image and data →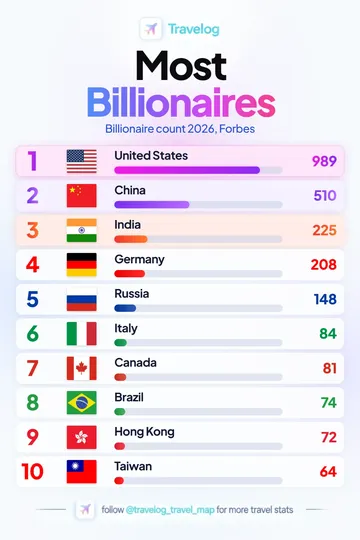
United States is listed first at 989 in this supplied graphic. Billionaire count 2026, Forbes.
View image and data →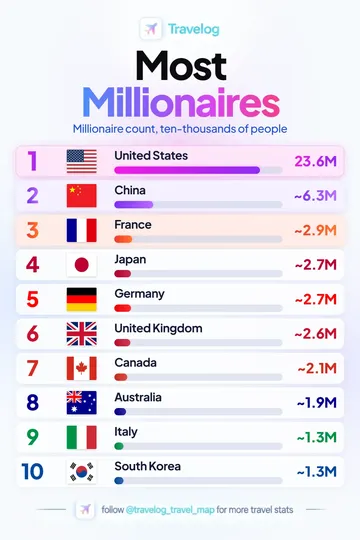
United States is listed first at 23.6M in this supplied graphic. Millionaire count, ten-thousands of people.
View image and data →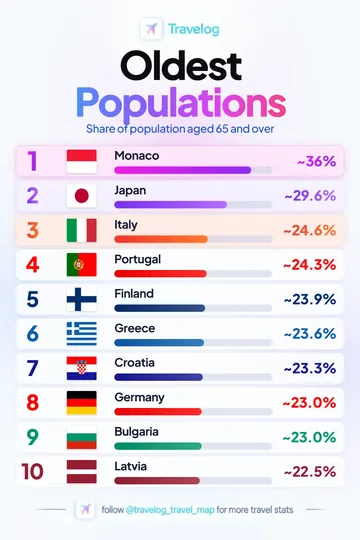
Monaco is listed first at ~36% in this supplied graphic. Share of population aged 65 and over.
View image and data →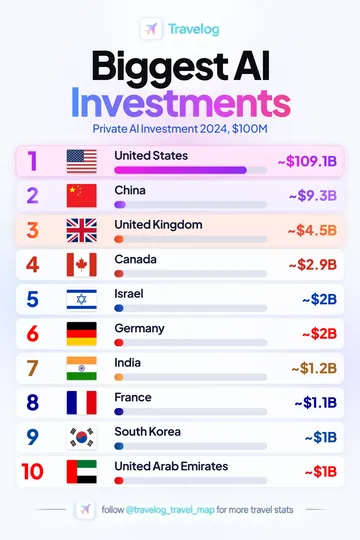
United States is listed first at ~$109.1B in this supplied graphic. Private AI Investment 2024, $100M.
View image and data →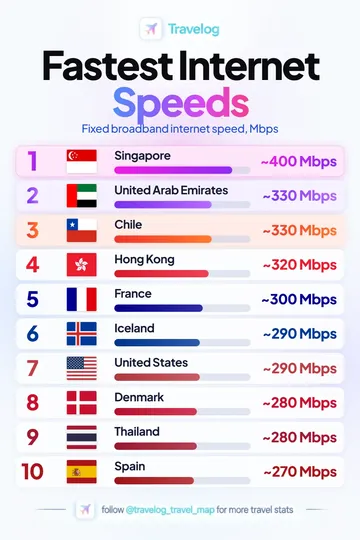
Singapore is listed first at ~400 Mbps in this supplied graphic. Fixed broadband internet speed, Mbps.
View image and data →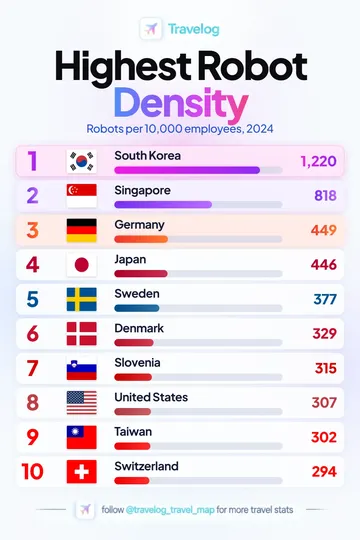
South Korea is listed first at 1,220 in this supplied graphic. Robots per 10,000 employees, 2024.
View image and data →
Nvidia is listed first at $125.7B in this supplied graphic. Semiconductor revenue 2025, $100M.
View image and data →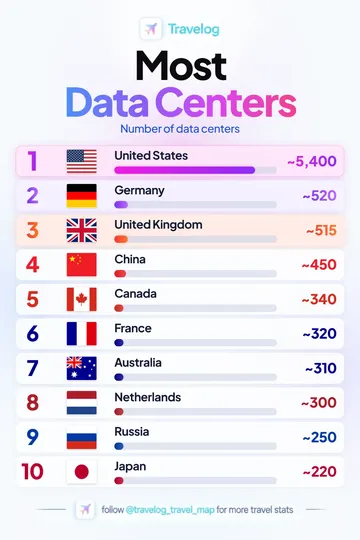
United States is listed first at ~5,400 in this supplied graphic. Number of data centers.
View image and data →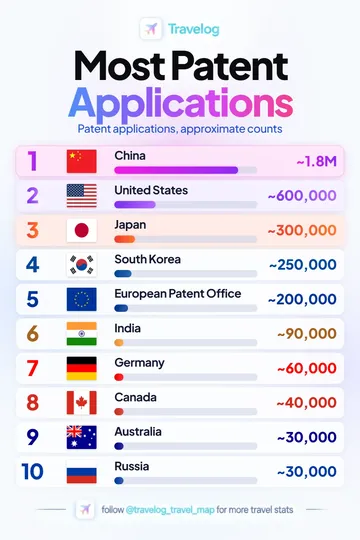
China is listed first at ~1.8M in this supplied graphic. Patent applications, approximate counts.
View image and data →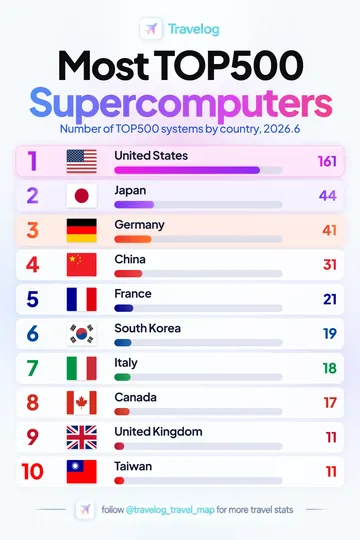
United States is listed first at 161 in this supplied graphic. Number of TOP500 systems by country, 2026.6.
View image and data →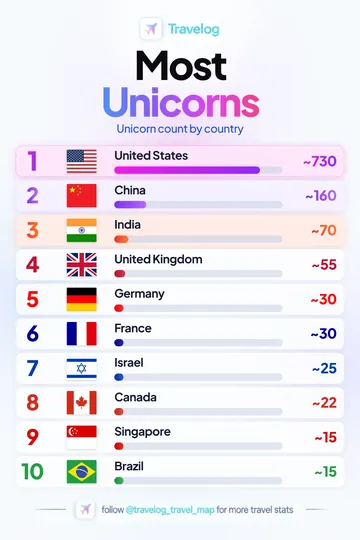
United States is listed first at ~730 in this supplied graphic. Unicorn count by country.
View image and data →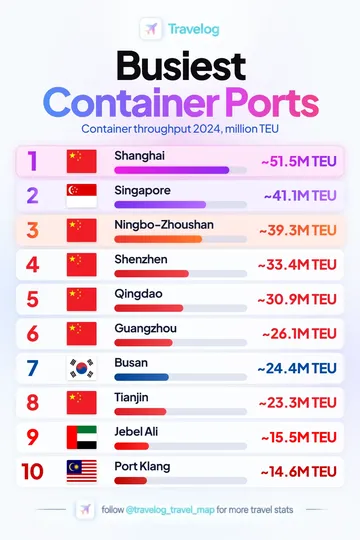
Shanghai is listed first at ~51.5M TEU in this supplied graphic. Container throughput 2024, million TEU.
View image and data →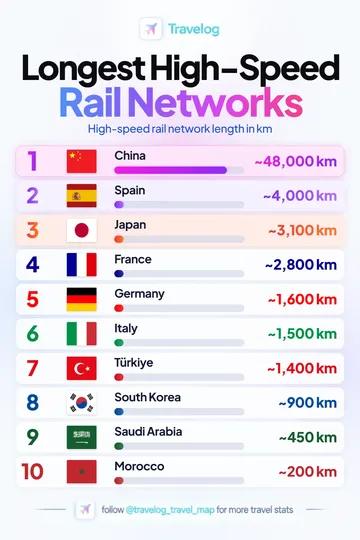
China is listed first at ~48,000km in this supplied graphic. High-speed rail network length in km.
View image and data →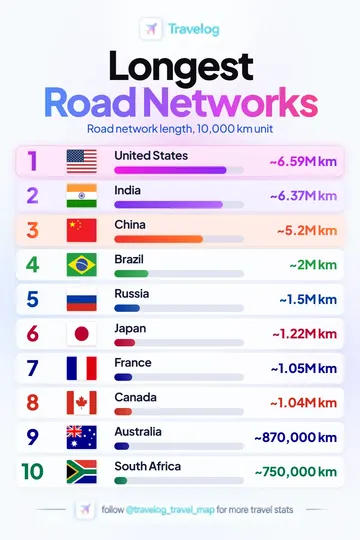
United States is listed first at ~6.59Mkm in this supplied graphic. Road network length, 10,000 km unit.
View image and data →
China is listed first at ~65% in this supplied graphic. Order share by country, 2025, %.
View image and data →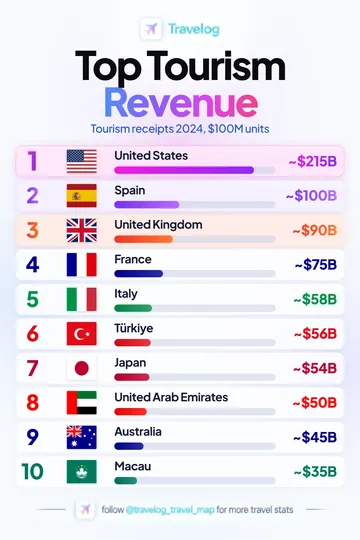
United States is listed first at ~$215B in this supplied graphic. Tourism receipts 2024, $100M units.
View image and data →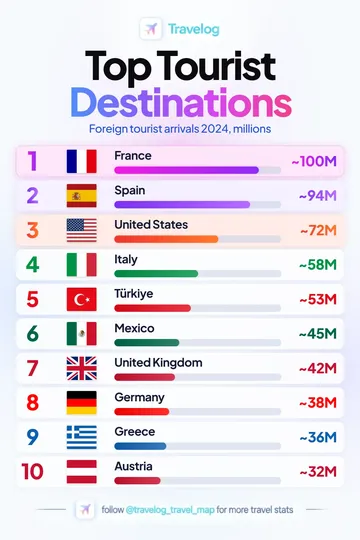
France is listed first at ~100M in this supplied graphic. Foreign tourist arrivals 2024, millions.
View image and data →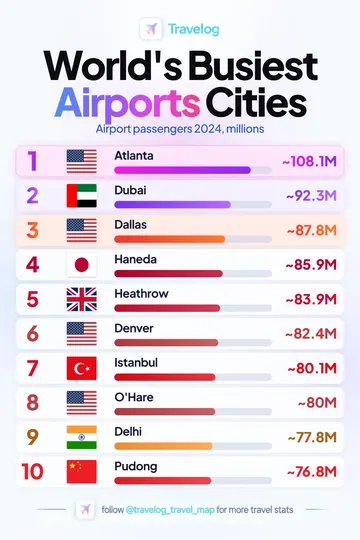
Atlanta is listed first at ~108.1M in this supplied graphic. Airport passengers 2024, millions.
View image and data →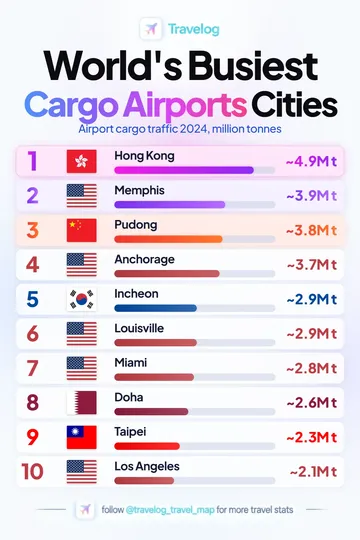
Hong Kong is listed first at ~4.9Mt in this supplied graphic. Airport cargo traffic 2024, million tonnes.
View image and data →No matching statistics. Try another place or topic.
Available for iOS and Android.