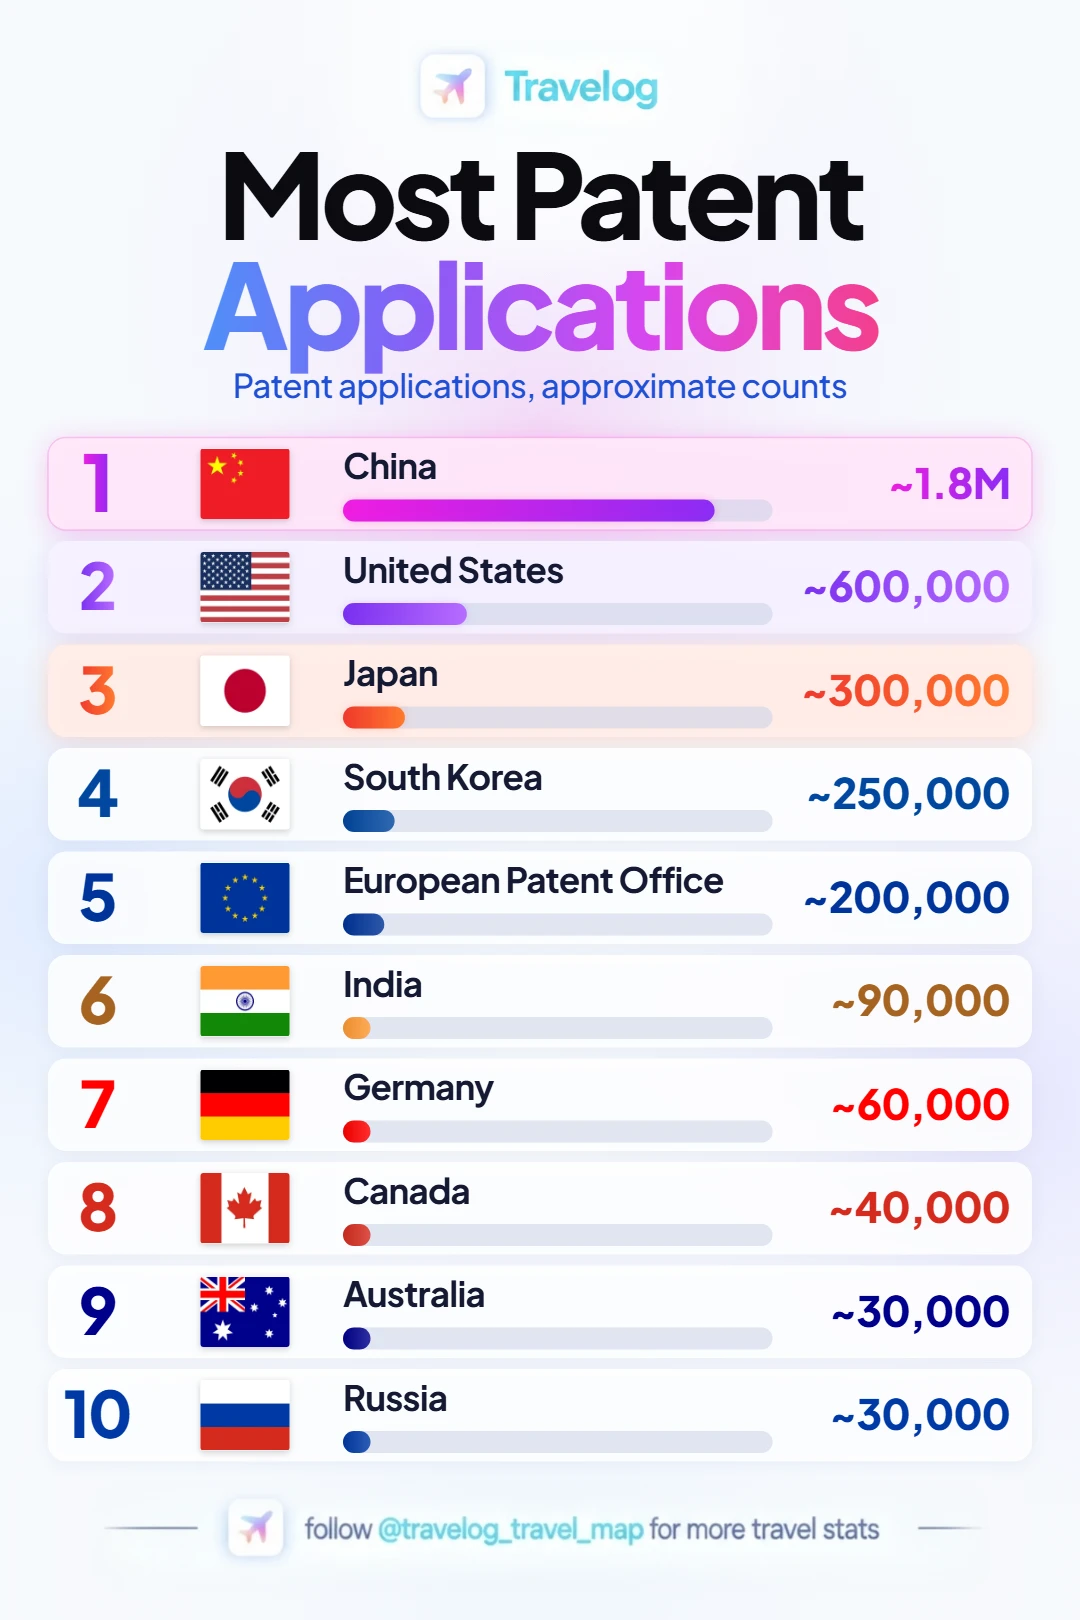
Ranking and values
Values in the units stated by the source graphic.
Most Patent Applications| # | Country or patent office | Reported value |
|---|
| 1 | China | ~1.8M |
|---|
| 2 | United States | ~600,000 |
|---|
| 3 | Japan | ~300,000 |
|---|
| 4 | South Korea | ~250,000 |
|---|
| 5 | European Patent Office | ~200,000 |
|---|
| 6 | India | ~90,000 |
|---|
| 7 | Germany | ~60,000 |
|---|
| 8 | Canada | ~40,000 |
|---|
| 9 | Australia | ~30,000 |
|---|
| 10 | Russia | ~30,000 |
|---|
 Travelog